Explain Constant function with graph
What is Constant function?
In this lesson, we will get the right understanding on what a constant function is and what it looks like on a graph. We will become comfortable identifying constant functions through real-world and mathematical examples.
What is a Constant Function?
Have you ever been shopping and you see a bargain bin, like the one pictured, where everything in the bin is a set price? If you have, lucky you for finding an awesome sale, but not only that, you actually came across a relationship between the items in that bin and their price that is an example of a constant function.
Mathematically, a constant function happens to be a function that has the same output value no matter what your input value is. So, for this, a constant function has the form y = b, where b is a constant (a single value that does not change). We can take an example like y = 7 or y = 1,094 are constant functions. No matter what input, or x-value is, the output, or y-value is always the same.
To simplify this even further, let's consider how to tell the difference between a constant function, and a function that is not a constant function. To decide if a function is a constant function, ask yourself, is it possible to get different outputs by using different inputs? If you can do that, then you do not have a constant function, but if it's only possible to get the same output no matter what you put in, then you have a constant function.
For example, think about the function y = x + 4. Can we get different outputs by varying our inputs? In this example, the answer is yes, because if I input x = 1, I get y = 1 + 4 or y = 5, and if I input x = 2, then I get y = 2 + 4 or y = 6. Since we can get different outputs by varying our inputs, this is not a constant function.
Now consider the function y = 7. Notice that no matter what our x value, or input, is, y is ALWAYS 7. If x = 3, y = 7 or if x = 5, y = 7 ; y is always 7 no matter what our input is. Therefore, we can't get different outputs by varying inputs, and that means this is a constant function.
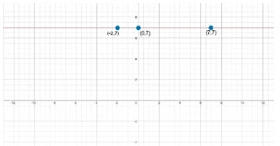
You may wonder what a constant function would look like on a graph. Well, if you've ever seen a horizontal line, then you've seen the graph of a constant function. Let's think about why this is the case. Graphically speaking, a constant function, y = b, has a y-value of b everywhere. This means there is no change in the y value, so the graph stays constantly on y = b, forming a horizontal line.
Consider our example of y = 7. The points on this graph all have a y-value of 7. For instance, (-2, 7), (0, 7), (7, 7), (1000, 7), and (-1000, 7) are all on this graph. When we graph all these points, we see that we get horizontal lines.

Now that we are starting to feel more comfortable with what a constant function is, let's look back at our bargain bin example, specifically, the photo of the books all costing $3.99. In this example, our input would be any book in that bin, and our output would be the cost. No matter what book we take out of that bin, the corresponding cost is $3.99. We see that this is a constant function which provides us a clear view about it.

Similar Questions
Explain Identity function with graph
View SolutionExplain signum function with graph
View SolutionExplain quadratic expression with graph
View SolutionExplain cube root function with graph
View SolutionExplain Exponential function with graph (a^x)
View SolutionExplain Modulus Function with graph
View SolutionExplain square root function with graph
View SolutionExplain cubic expression with graph
View SolutionExplain Reciprocal functions with graph
View SolutionFunction and Graph
View Solution
