Explain Exponential function with graph (a^x)
What is Exponential function and properties?
Exponential functions are not similar to algebraic functions. It is somewhat different than the algebraic function. Algebraic functions are either rational or a root of a rational number. These are represented using arithmetic operations.
Now, we will learn about the exponential function. These functions may not be expressed as rational or roots of rational numbers.
Exponential functions can be solved on a paper; however, you will require a calculator to find the approximate value in decimals. If in an equation both exponential & algebraic solutions are present, then the solution can be represented as a graphical or numerical method.
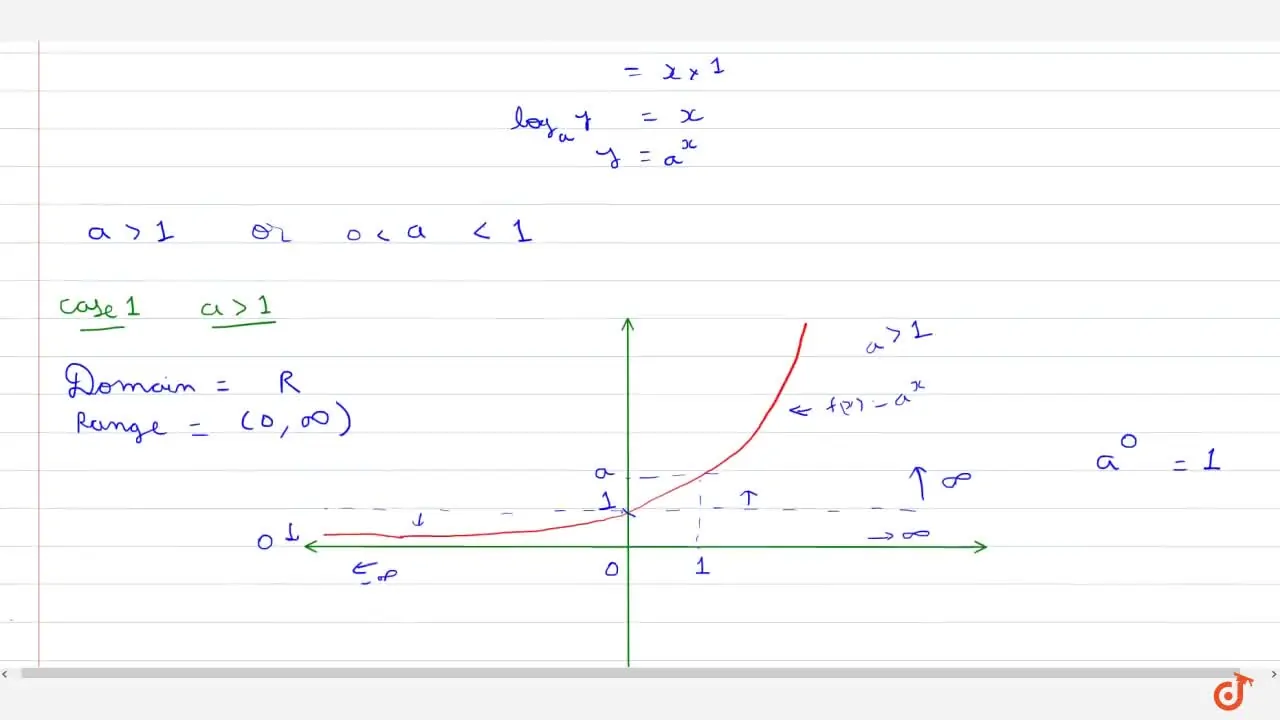
The easiest exponential function is: f(x) = ax, a>0, a≠1
Exponential functions have some restrictions and reason is given below:
Reason: Suppose a≤0, and if you raise it to rational power, you may not obtain a real number. Example: If a=-3, then (-3)0.5 = sqrt(-3) which isn't real number. When a=1, then regardless of what x is, the value of f(x) will be 1.
As we know that one to one functions have numerous properties and have inverses that are functions as well. The particular functions are applicable on both sides of an equation.
Graphs of Exponential Functions

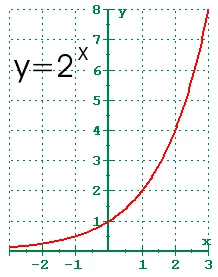
The graph of y=2x is shown above. Here are some exponential function properties when the base is greater than 1.
- The graph passes through the co-ordinates (0,1)
- The domain contains all real numbers
- The range is y>0.
- The graph is increasing
- The graph is asymptotic to the x-axis as x approaches negative infinity
- The graph increases without bound as x approaches positive infinity
- The graph is continuous
- The graph is smooth
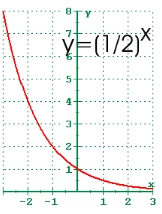
In case, if you replaced every x with -x, then the translation would be a reflection for the y-axis. Also, if we raise a base to a negative power, the result would be the reciprocal of the number. Therefore, to graph y=2-x, the graph would be a reflection about the y-axis of y=2x and the function would be y=(1/2)x.

The graph of y=2-x is depicted above. Exponential function properties and its graph when the base is between 0 and 1 are mentioned.
- The graph passes through the co-ordinates (0,1)
- The domain contains all real numbers
- The range is y>0.
- The graph is decreasing
- The graph is asymptotic to the x-axis as x approaches positive infinity
- The graph increases without bound as x approaches negative infinity
- The graph is continuous
- The graph is smooth
Only notice the behaviour at the left-hand and right-hand ends and the differences regarding whether the function is decreasing or increasing.
Exponential Graphs -Translations
A horizontal translation of exponential graph may affect the increasing / decreasing (if multiplied by a negative), the left hand / right hand behaviour of the graph, and the y-intercept; however, it would not change the horizontal asymptote location.
A vertical translation might affect the increasing / decreasing (if multiplied by a negative), the y-intercept, and the horizontal asymptote location. It will not change whether the graph is asymptotic (although it might change where it is asymptotic) to the left/right, or the graph goes without bound.
If you know the features of the basic graphs, then you can apply the particular translations to sketch the new function easily.
Now, you must add the exponential graph from the front cover of the text to the list of those you know.
The natural base ‘e’
When ‘x’ increases without bound, the value (1+1/x)^x will move closer to the Euler’s number e.

The limit notation depicted above is from calculus. The particular notation is a way of asking as to what happens to the expression as x approaches the value represented. The specific limit is the dividing element between algebra and calculus. Calculus is simply the algebra with the concept of limit. People always do not understand calculus. People do not perform well in calculus is not because of the calculus, but because they are poor at algebra. The calculus itself is easy.
The value for ‘e’ is approximately 2.718281828. A slightly more accurate approximation here is..
2.71828 18284 59045 23536 02874 71352 66249 77572 47093 69995 95749 66967 62772 40766 30353 54759 45716 82178 52516 64274 27466 39193 20030 59921 81741 35966 29043 57290 03342 95260 59563 07381 32328 62794 34907 63233 82988 07531 95251 01901 15738 34187 93070 21540 89149 93488 41675 09244 76146 06680 82264 80016 84774 11853 74234 54424 37107 53907 77449 92069 55170 27618 38606 26133
When the base ‘e’ is used, the exponential function turns into f(x) = ex. The exponential function with base ‘e’ is abbreviated as exp(). This abbreviation appears when writing computer programs.
Compounded Interest
Exponential functions can figure out the amount in your savings account. Each month, you receive 1/12 of the yearly interest rate (r) applied to the bank account. The new balance in the account is 100% of the initial amount along with plus r%/12 of the initial amount. It implies that the current amount will be (100%+r%/12) of the principal amount. The next month, there will be the same trend, with an except it will be based on what you had at the end of the first month.
Compound interest, A = P (1+i) n.
Where ‘A’ is Amount in the bank account. ‘P’ is the principal amount you started with. i is the periodic rate, which is the annual per cent (written as a decimal) r, divided by the number of periods per year. ‘n’ is the number of compounding periods that is equal to the number of periods per year, m, times the time in years, t. The formula I have shown above differs slightly from the formula in the book, but agrees with the formula that you'll use if you go on to Finite Mathematics (Math 160). In Finite Mathematics, there is an entire chapter on finance and the formulas involved.
Continuous Compounding and Growth / Decay
Previously, there was continuous compounding of interest. Presently, it is not in practice because it gives the maximum return on the investment, and then banks are in business to make money, just like any other for profit Organisation.
The model for continuous compounding is A = P ert.
A is the Amount, P is the Principal, r is the annual percentage rate (written as a decimal), and t is the time in years. e is the base for natural logarithms.
However, the continuous model makes sense for population growth and radioactive decay. The radioactivity of an isotope does not change once a month at the end of the month, it is continually changing.
The exponential model is y = A ekt,
where ‘y’ is the amount present at time t. A is the initial amount present, and k is the rate of growth (if positive) or the rate of decay (if negative).


Similar Questions
Explain Reciprocal functions with graph
View SolutionExplain Constant function with graph
View SolutionExplain Identity function with graph
View SolutionExplain square root function with graph
View SolutionExplain cubic expression with graph
View SolutionExplain cube root function with graph
View SolutionWhat is exponential function ?
View SolutionExplain quadratic expression with graph
View SolutionExplain signum function with graph
View SolutionExplain Modulus Function with graph
View Solution


