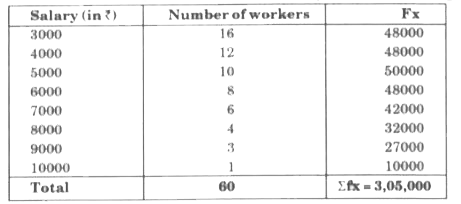
Find the mean salary of 60 workers of a factory from the following table :
 Solution in Kannada
The correct Answer is:5083.33
Step by step video, text & image solution for Find the mean salary of 60 workers of a factory from the following table : by Maths experts to help you in doubts & scoring excellent marks in Class 9 exams.
Topper's Solved these Questions
- BOOK - CPC CAMBRIDGE PUBLICATIONCHAPTER - STATISTICSEXERCISE - EXERCISE 14.39videos
STATISTICS
- BOOK - CPC CAMBRIDGE PUBLICATIONCHAPTER - QUADRILATERALSEXERCISE - EXERCISE 7.27videos
QUADRILATERALS
- BOOK - CPC CAMBRIDGE PUBLICATIONCHAPTER - SURFACE AREAS AND VOLUMES EXERCISE - EXERSICE 13.810videos
SURFACE AREAS AND VOLUMES
Similar Questions
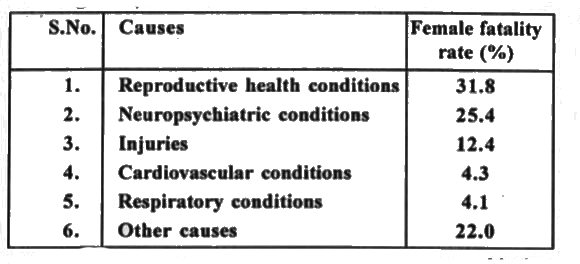
A survey conducted by an organisation for the cause of illness nad death among the women between the ages 15-44 (in years) worldwide, found the following figures (in %) :

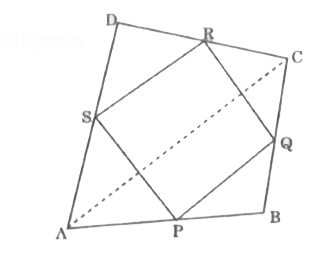
(ii) Which condition is the major cause of women's ill health and death worldwide ?06:07View SolutionABCD is a quadrilateral in which P,Q,R and S are mid points of the sides AB,BC,CD and DA. AC is a diagonal Show that:
SR∣∣ACandSR=12AC
PQ=SR
PQRS is a parallelogram
 02:11View Solution
Find the volume of a sphere whose radius is
(i) 7 cm,
(ii) 0.63m01:31View SolutionWhich of the following are correct chain isomers of butane ? (i)
02:45View SolutionDetermine the point of symmetry of a regular hexagon.
02:17View SolutionDtermine the images of the following figure about the given line :
05:41View SolutionMatch the following Column A to Column B
 03:28View Solution
Match the following Column A to Column B
 02:31View Solution
Match the following Column A to Column B
 02:21View Solution
Find the area of figure given below.
 02:10View Solution
Find the perimeter of the figure given below.
 02:17View Solution
Find the area of the figure given below.
 02:10View Solution
The inequation represented by the graph given below is :
01:13View SolutionThe inequation that best describes the graph given below is _________
02:41View SolutionThe inequation that best describes the following graph is _________
03:10View SolutionIn Fig, find the value of x.
ltimg src="https://d10lpgp6xz60nq.cloudfront.net/physics_images/PS_MATH_IX_C12_S01_032_Q01.png" width="80%"gt01:44View Solution

