Find the mode of the following frequency table, which gives the marks scored by 40 students in a test:

The marks obtained 5 has highest frequency. Therefore, mode is 5.
Topper's Solved these Questions
- BOOK - NAGEEN PRAKASHAN ENGLISHCHAPTER - STATISTICSEXERCISE - Problems From NCERT/exemplar22videos
STATISTICS
- BOOK - NAGEEN PRAKASHAN ENGLISHCHAPTER - STATISTICSEXERCISE - Exercise 14a10videos
STATISTICS
- BOOK - NAGEEN PRAKASHAN ENGLISHCHAPTER - QUADRILATERALSEXERCISE - Revision Exercise (long Answer Questions)5videos
QUADRILATERALS
- BOOK - NAGEEN PRAKASHAN ENGLISHCHAPTER - SURFACE AREA AND VOLUMEEXERCISE - Revision Exercise (long Answer Questions)10videos
SURFACE AREA AND VOLUME
Similar Questions
Find the mode of the following frequency distribution
 View Solution
Find the mode of the following frequency distribution :
 View Solution
Find the mode of the following frequency distribution of marks obtained by 50 students. Marks obtained 0−10 10−20 20−30 30−40 40−50 No. of students 5 12 20 10 3
View SolutionFind the mode of the following distribution of marks obtained by 80 students: Marks obtained 0-10 10-20 20-30 30-40 40-50 No. of students 6 10 12 32 20
View SolutionFind the mode of the following distribution of marks obtained by 80 students: Marks obtained 0-10 10-20 20-30 30-40 40-50 No. of students 6 10 12 32 20
View SolutionFind the mode of the following distribution of marks obtained by 80 students: Marks obtained 0-10 10-20 20-30 30-40 40-50 No. of students 6 10 12 32 20
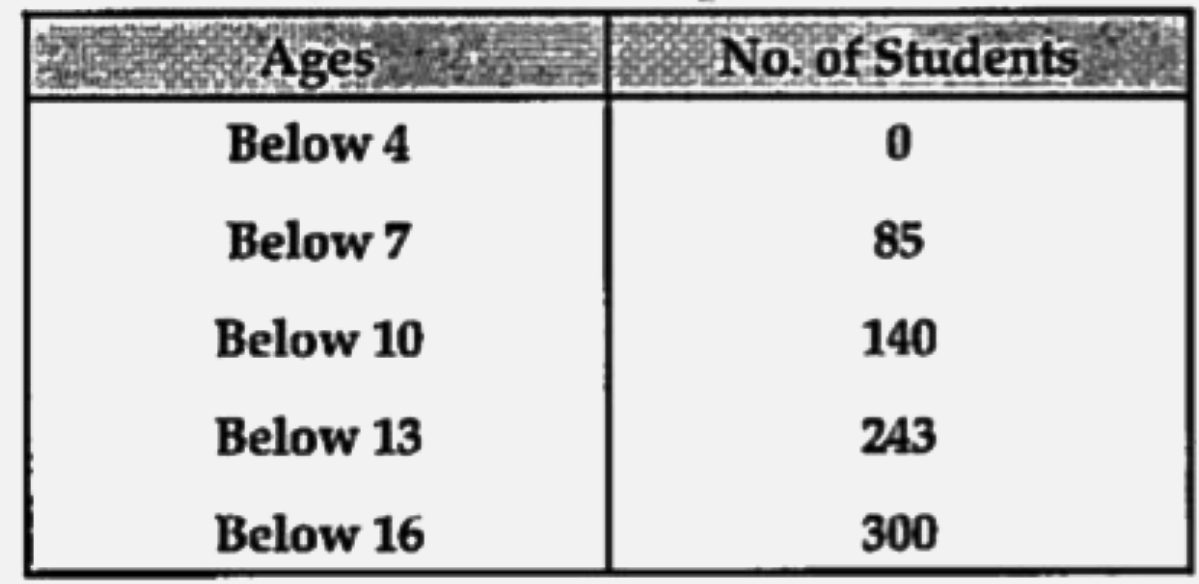
View SolutionConstruct the frequency distribution table from the following cumulative frequency table :

State the number of students in the age group 10 - 13.View SolutionIf for somex∈R, the frequency distribution of the marks obtained by 20 students in a test is:

Then the mean of the marks is:View SolutionThere are 60 students in a class. The followng is the frequency distribution of marks obtained by the students in a test.

where x is positive integer. Determine the mean of the marks.View SolutionFind the mean from the following frequency distribution of marks at a test in statistics: Marks (x) : 5 10 15 20 25 30 35 40 45 50 No. of students (f) : 15 50 80 76 72 45 39 9 8 6
View Solution

