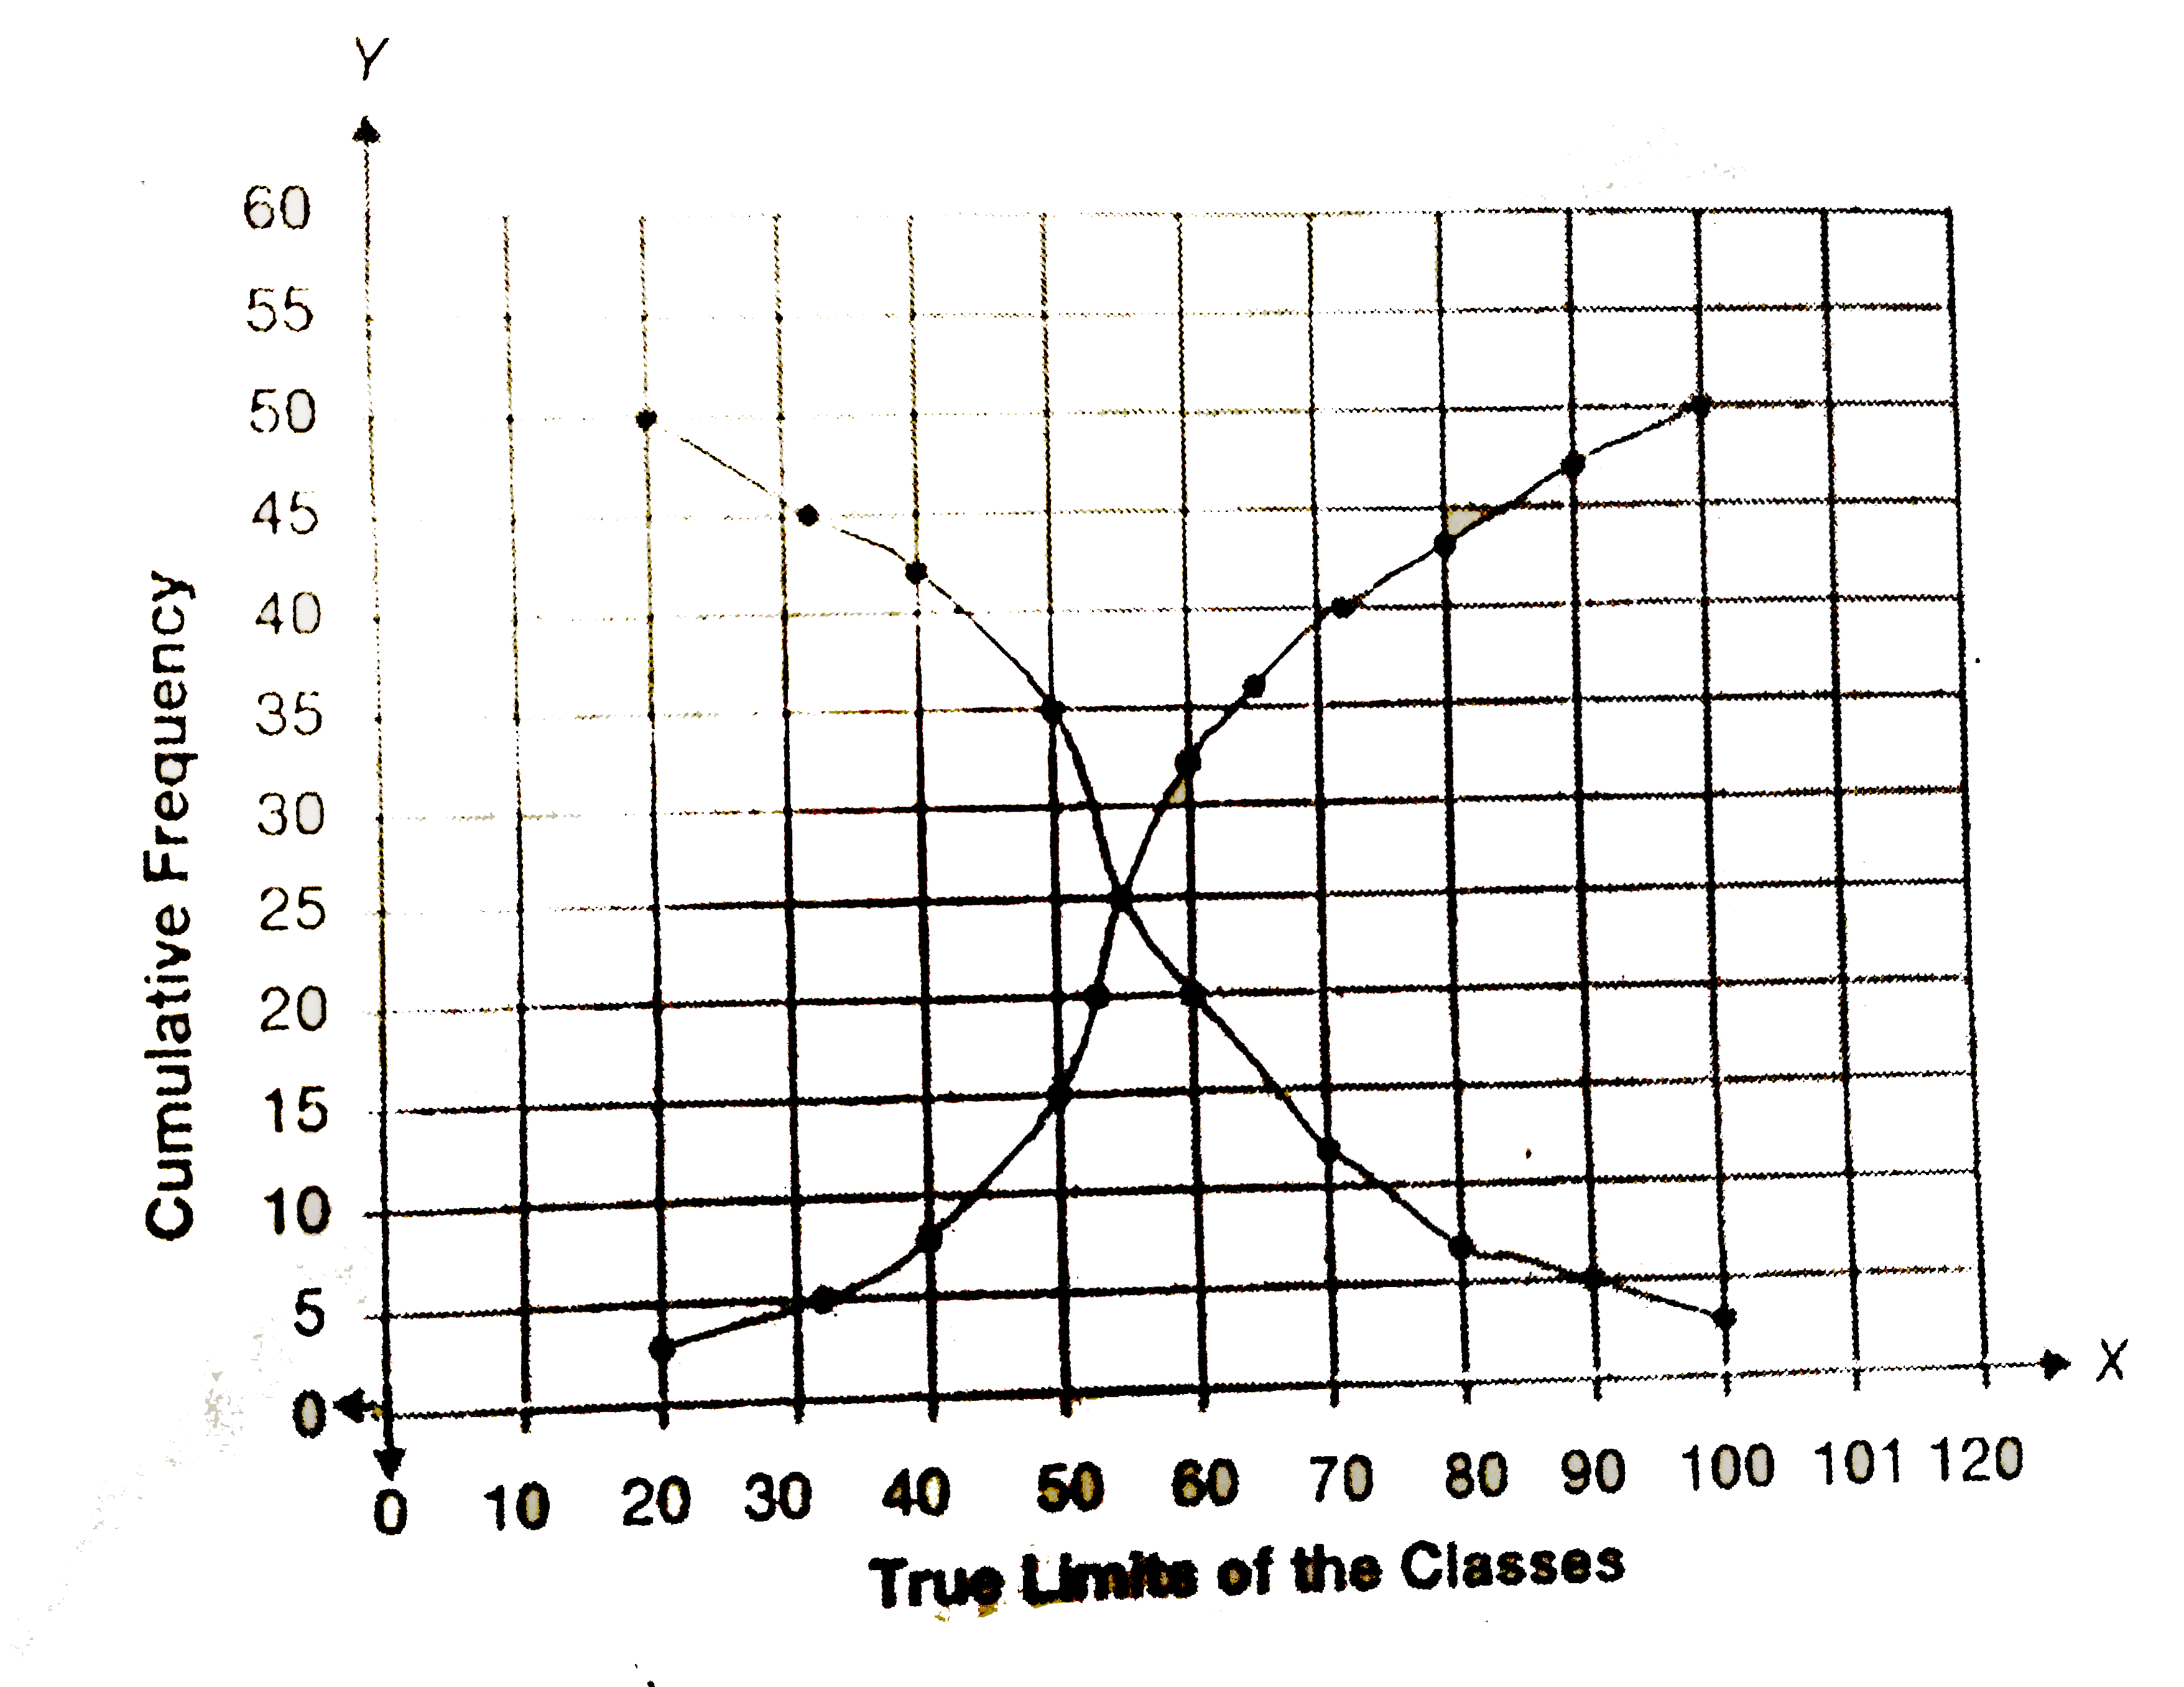
Find the number of students who scored less than or equal 50% of marks .
35
15
20
30
The correct Answer is:b
In the given graph , one curve represents the less than cumulative frequency , another curve represents the greater than cumulative frequency .
Topper's Solved these Questions
- STATISTICS BOOK - PEARSON IIT JEE FOUNDATIONCHAPTER - STATISTICS EXERCISE - Level 3
14 Videos
- STATISTICS BOOK - PEARSON IIT JEE FOUNDATIONCHAPTER - STATISTICS EXERCISE - Level 1
28 Videos
- SHARES AND DIVIDENDSBOOK - PEARSON IIT JEE FOUNDATIONCHAPTER - SHARES AND DIVIDENDSEXERCISE - Level 3
15 Videos
- TAXATION BOOK - PEARSON IIT JEE FOUNDATIONCHAPTER - TAXATION EXERCISE - LEVEL 3
10 Videos
Similar Questions
The following table shows the marks of 90 students in a test of 80 marks :
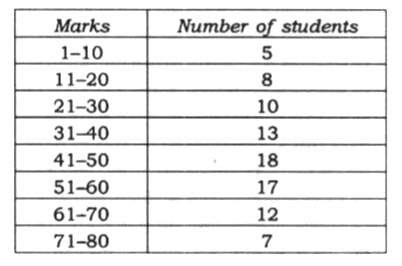
The percentage of students who have obtained less than or equal to 50% marks is
View SolutionThe given graph shows the marks obtained by students in an examination
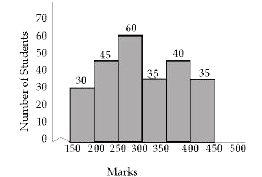
The number of students who obtained less than 300 marks is what percent more than the number of students who obtained 350 or more marks
View Solution
Knowledge Check
In each of the following questions, a is followed by information given in three statements. You have to decide the information given in which of the statements is necessary and sufficient to answer the question.
How many students secured at least per cent marks in Mathematics in a class of 240 students?
(1) 20 percent of the student in the class secured 80 per cent and above marks in Mathematics
(2) 80 studethave secured more than 50 per cent but less than 60 per cent marks in Mathematics
(3) The number of students who secured marks between 60 and 79 per cent was equal to the number of students who secured less than 50 per cent marks in MathematicsAAll (1) and (3) are necessary to answer the questionBOnly (1) and (3) are sufficientCOnly (2) and (3) are sufficientDThe question cannot be answered even with all (1),(2),(3)Study the given histogram that shows the marks obtained by students in an examination and answer the question that follows .
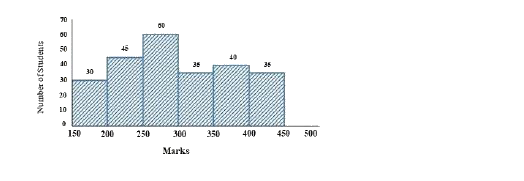
The number of students who obtained less than 250 marks is :A135B75C30D45Study the given histogram that shows the marks obtained by students in examination and answer the question that follows
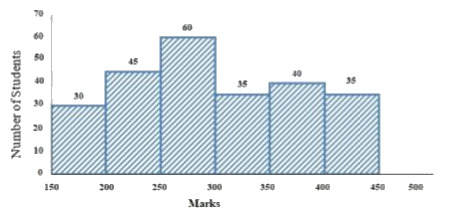
The number of students who obtained less than 200 marks is :AA)45BB)135CC)30DD)75
The given graph shows the marks obtained by students in an examination.
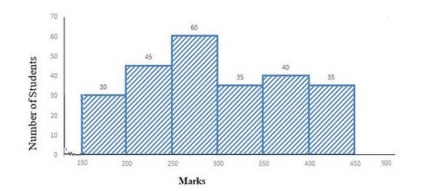 The number of students who obtained less than 300 marks is what percent more than the number of students who obtained 350 or more marks?
View SolutionIn question 2 above, the number of students who scored marks less than 4 is
View SolutionThe distrubution of marks (out of 150) obtained by 180 students in each of the five subjects
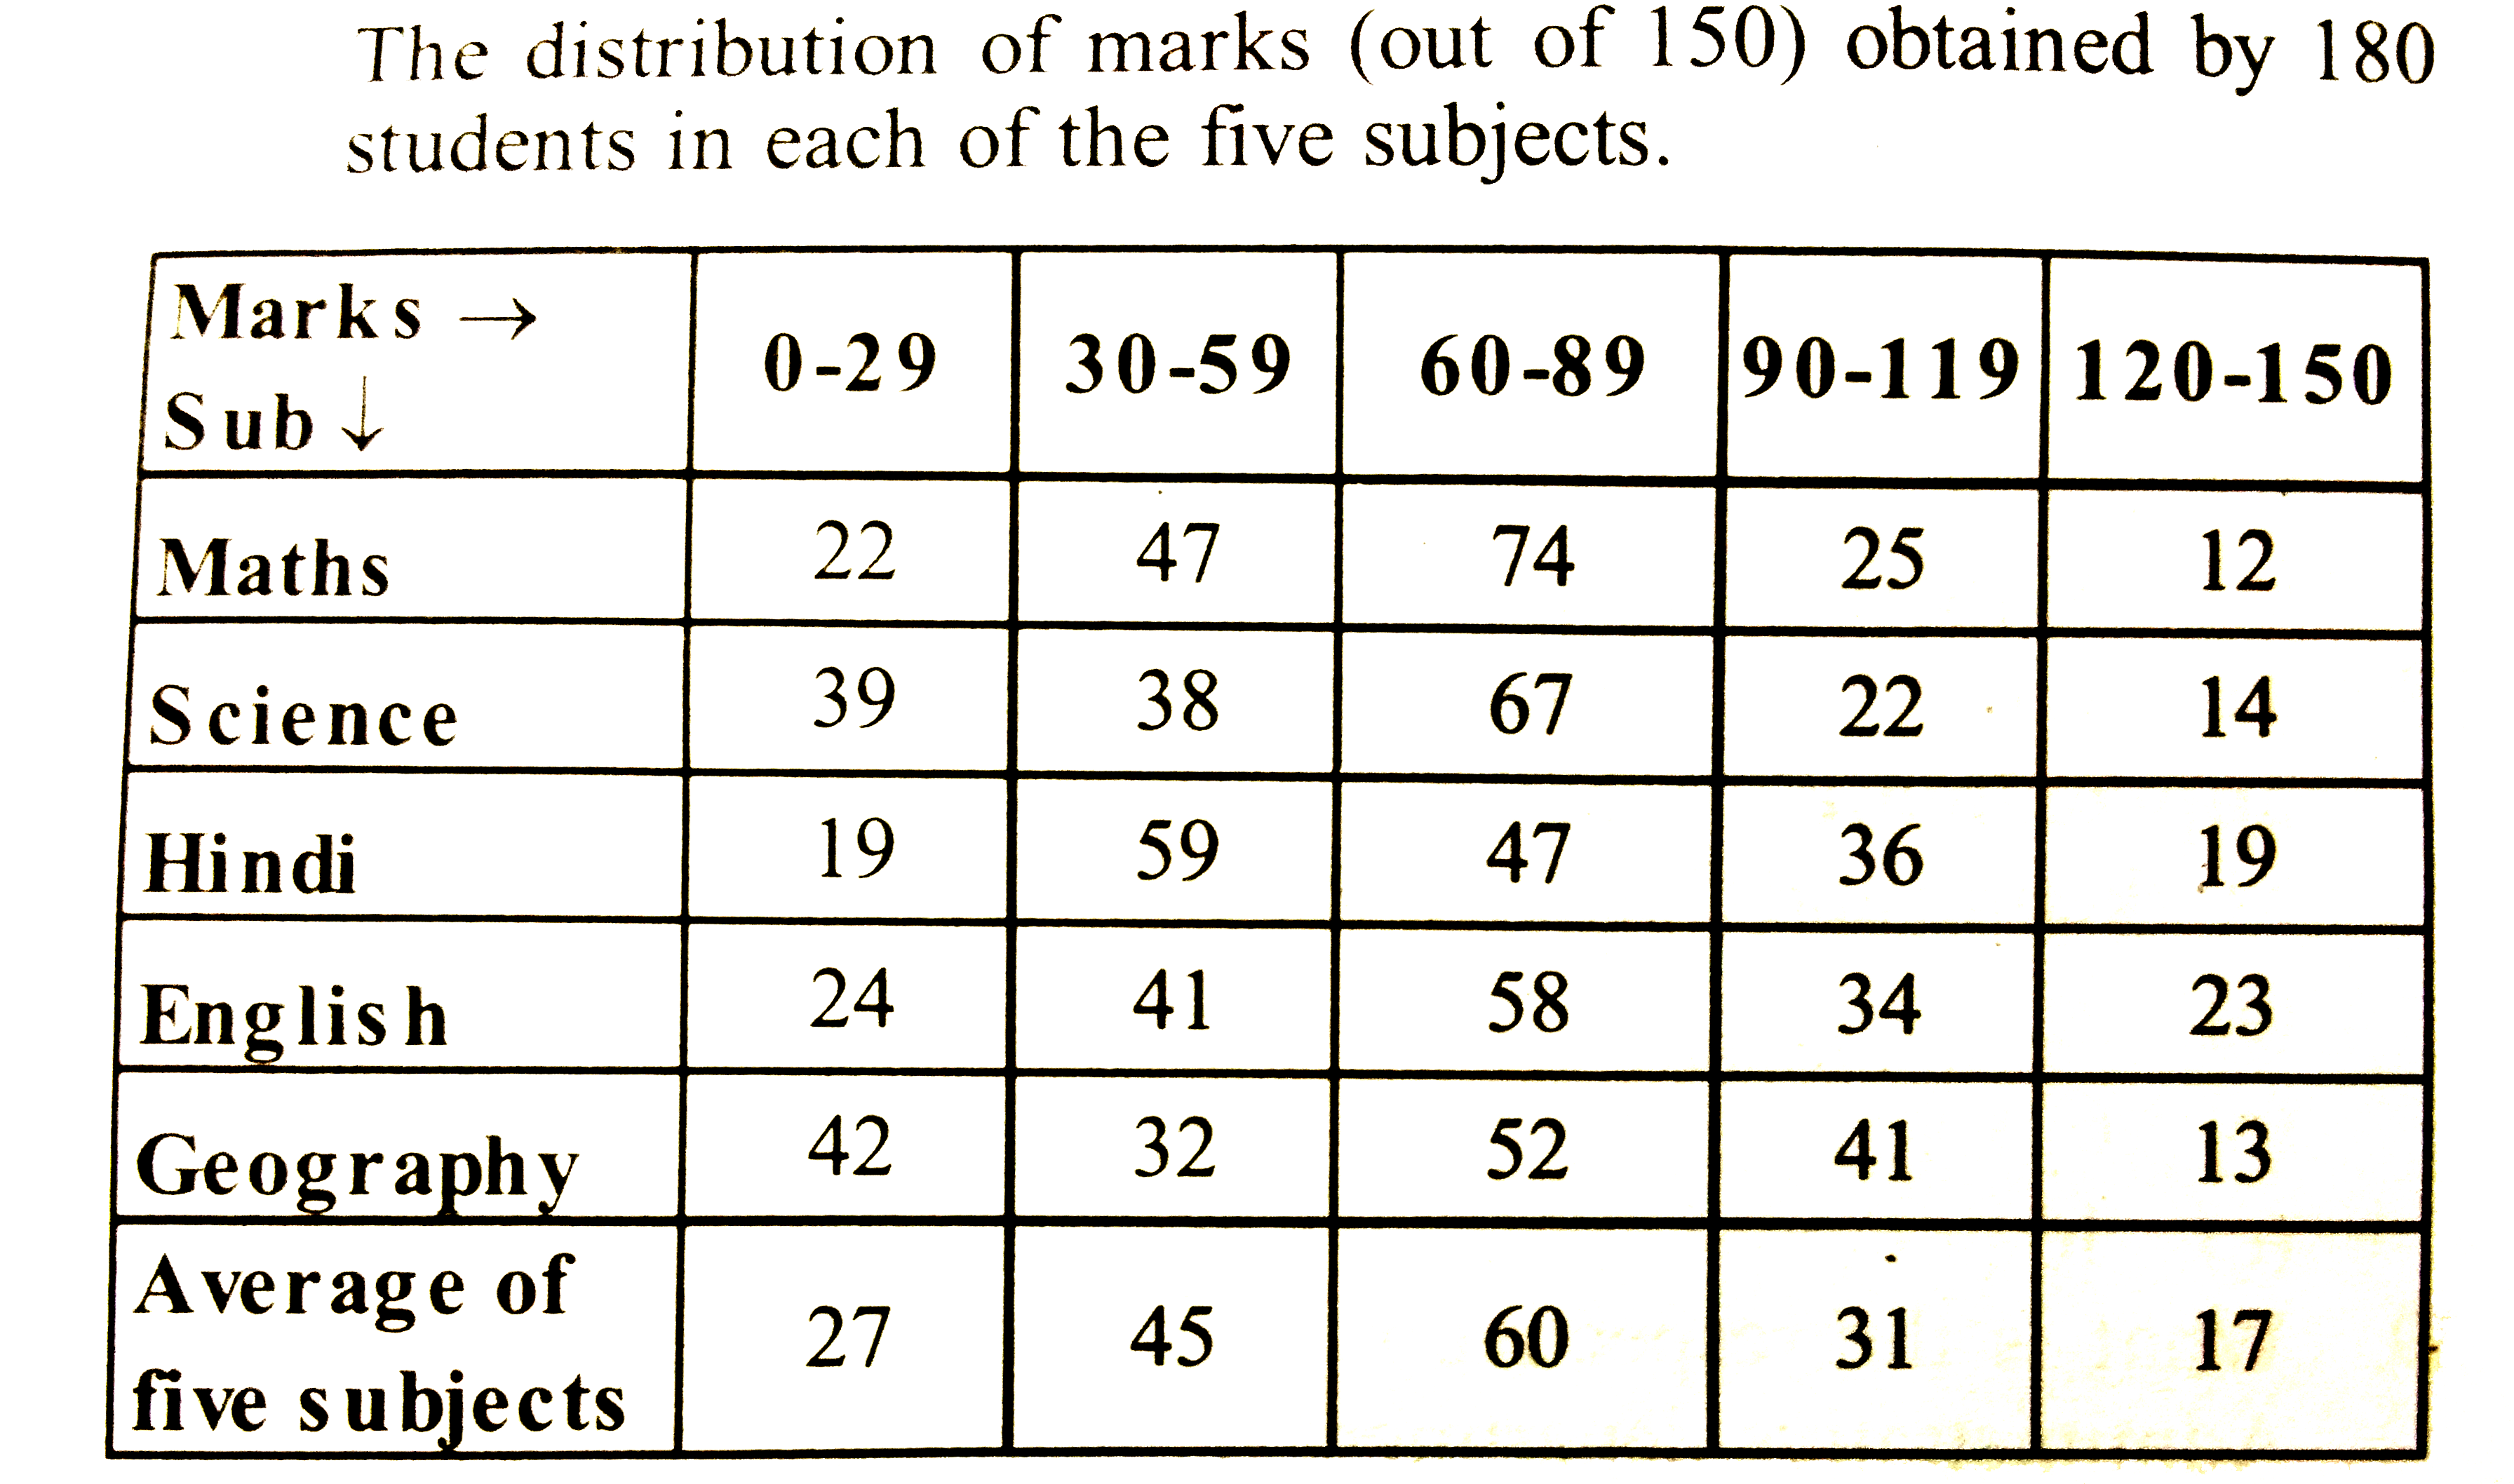
The no. of students who obtained more than or equal to 40% marks in Science is what per cent less than that of those who secored less than or equal to 60% in Hindi ?
View SolutionThe histogram shows the number of students and the range of marks scored by them
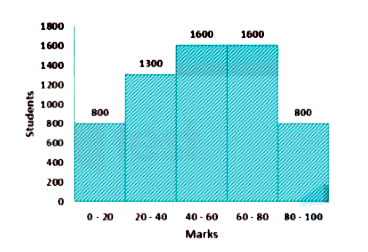
Find the ratio of students who scored marks less than 40 and the students who scored marks greater than 60?
View SolutionMarks obtained by 7 students in a subject are 30, 55, 75, 90, 50, 60, 39. The number of students securing marks less than the mean marks is
View Solution
