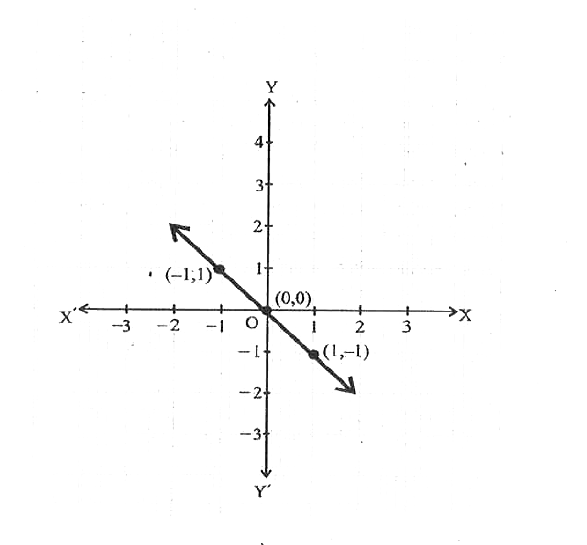
From the choices given below, choose the equation whose graphs are in fig (i) and fig (ii), in fig (i)
 Solution in Kannada
y=x
x+y=0
y=2x
2+3y=7x
The correct Answer is:B
Step by step video, text & image solution for From the choices given below, choose the equation whose graphs are in fig (i) and fig (ii), in fig (i) by Maths experts to help you in doubts & scoring excellent marks in Class 9 exams.
Updated on:21/07/2023Topper's Solved these Questions
- LINEAR EQUATIONS IN TWO VARIABLESBOOK - SUBHASH PUBLICATIONCHAPTER - LINEAR EQUATIONS IN TWO VARIABLESEXERCISE - EXERCISE 10.4
4 Videos
- LINEAR EQUATIONS IN TWO VARIABLESBOOK - SUBHASH PUBLICATIONCHAPTER - LINEAR EQUATIONS IN TWO VARIABLESEXERCISE - EXERCISE 10.4
4 Videos
- INTRODUCTION TO EUCLID'S GEOMETRYBOOK - SUBHASH PUBLICATIONCHAPTER - INTRODUCTION TO EUCLID'S GEOMETRYEXERCISE - EXERCISE 2.1
16 Videos
- LINES AND ANGLES BOOK - SUBHASH PUBLICATIONCHAPTER - LINES AND ANGLES EXERCISE - EXERCISE 3.3
6 Videos
Similar Questions
Give geometric representation of y=3 as an equation
in one variable
View SolutionGive geometric representation of y=3 as an equation
in one variable
View SolutionWhich of the following statements are true and which are false ? Give reason for your answers.
(i) Only one line can pass through a single point.
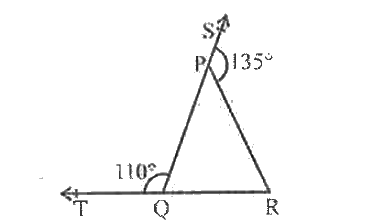
View SolutionIn Fig , sides QP and RQ and RQ of ΔPQR are produced to points S and T respectively . If ⌊SRP=135∘and⌊PQT=110∘, find ⌊PRO.

View SolutionIn given diagram (Fig. 19.16) which part maintains the concentration of medulary interstitium.
View SolutionWhich of the following are correct chain isomers of butane ? (i)
View SolutionDetermine the point of symmetry of a regular hexagon.
View SolutionMatch the following Column A to Column B

View SolutionMatch the following Column A to Column B

View SolutionMatch the following Column A to Column B

View SolutionThe inequation represented by the graph given below is :
View SolutionThe inequation that best describes the graph given below is _________
View SolutionThe inequation that best describes the following graph is _________
View SolutionIn fig. O is the center of the circle. Find the value of x.
ltimg src="https://d10lpgp6xz60nq.cloudfront.net/physics_images/PS_MATH_IX_C12_S01_031_Q01.png" width="80%"gt
View SolutionIn Fig, find the value of x.
ltimg src="https://d10lpgp6xz60nq.cloudfront.net/physics_images/PS_MATH_IX_C12_S01_032_Q01.png" width="80%"gt
View Solution
