Graph the functions f(x)=x3andg(x)=3√x on the same coordinate plane. Find f o g and graph it on the plane as well. Explain your results.Solution in Tamil
Step by step video & image solution for Graph the functions f(x) = x^3 and g(x) = root(3)(x) on the same coordinate plane. Find f o g and graph it on the plane as well. Explain your results. by Maths experts to help you in doubts & scoring excellent marks in Class 11 exams.
Updated on:21/07/2023Topper's Solved these Questions
Similar Questions
Find the largest possible domain for the real valued functions f defined by f(x)=√x2−5x+6
View SolutionIf A= {(x,y) : y = ex,x∈R} and B = { (x,y) : y = e−x,x∈R } then n (A ∩ B ) is
View Solution1cos80∘−√3sin80∘=
View SolutionLet the function f:R→Randg:R→R be defined by f(x)=x2andg(x)=x+3, evaluate
(f o g) (2) , (ii) (g o f) (3)
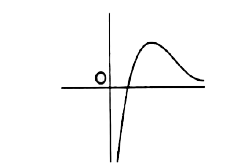
View SolutionThe graph of function f(x) is shown below :

Then the graph of g(x)=1f(|x|) is:
View SolutionIf f(x) = 3√x and g(x) = x3+8 , find (f∘g) (3) .
View SolutionFunctiuon g is related to function f by the equation g(x)=f(x−1)−2. If the point (4,3) is on the graph of function f, what are the coordinates of the corresponding point on the graph of function g?
View Solution
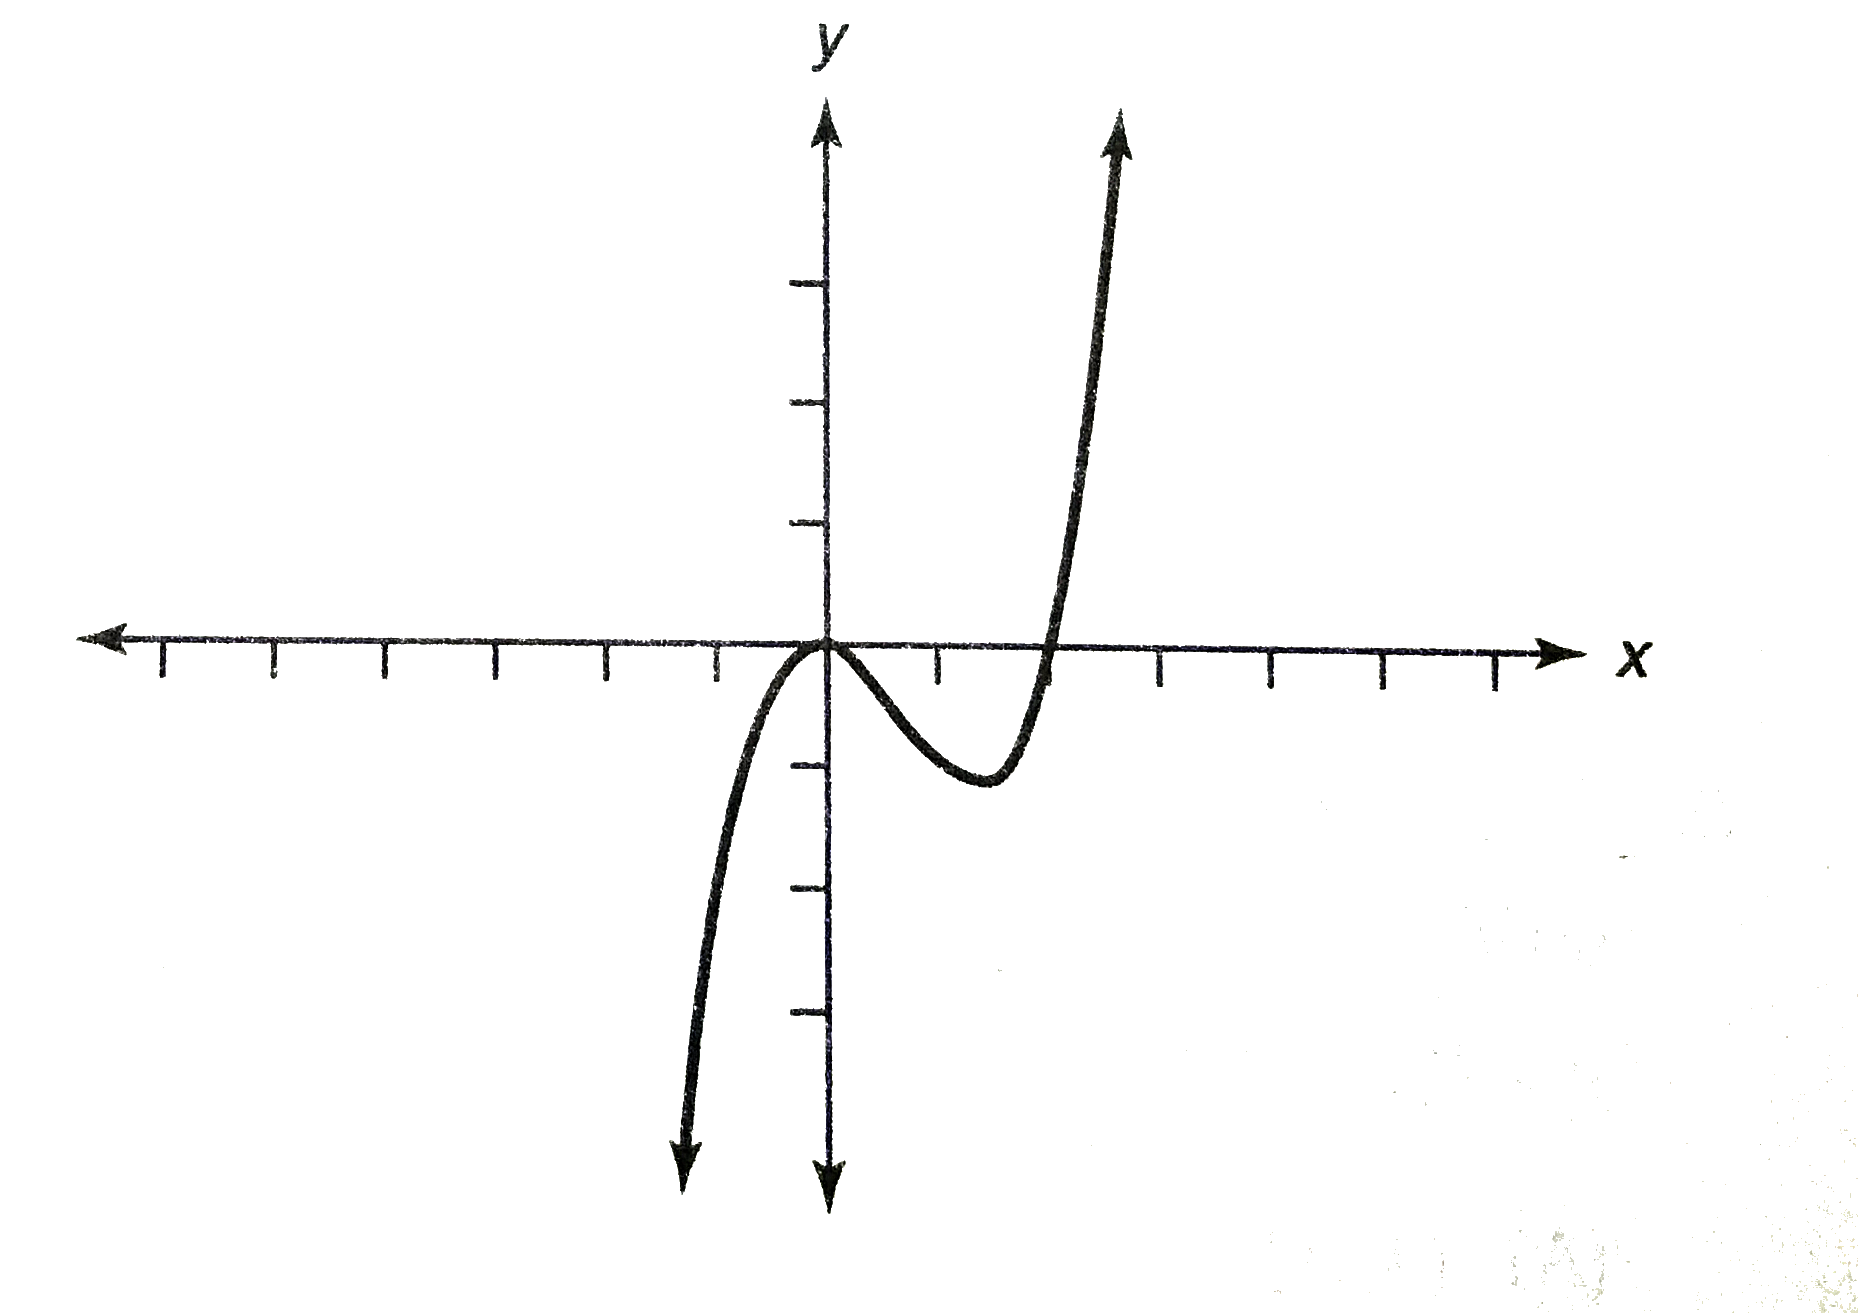
The figure above shows the graph of function f. If g(x)=−f(x), which graph represents function g?
View SolutionGraph the functions f (x) = x3 and g(x) = 3√x on the same co-ordinate plane. Find fog and graph it on the plane as well. Explain your results.
View SolutionThe function f is defined by f (x) = (x + 3)(x + 1). The graph of f in the xy-plane is a parabola. Which of the following intervals contains the x-coordinate of the vertex of the graph of f ?
View Solution
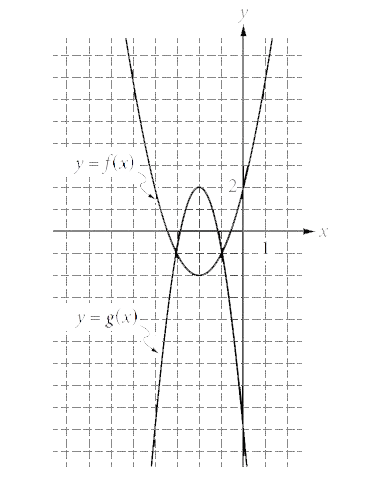
Graphs of the functions f and g are shown in the xy-plane above. For which of the following values of x does f(x)+g(x)=0 ?
View SolutionFor the function f(x)=x2+2x−6, If the graph of f(x) is reflected across the x-axis , the graph of a new function, g(x) , is produced . Find g(3) .
View SolutionThe function y=f(x) is graphed in the standard (x, y) coordinate plane below.

The points on the graph of the function y=3+f(x−1) can be obtained from the points on y=f(x) by a shift of:
View SolutionThe graph of function f(x) is shown below :

Then the graph of g(x)=1f(|x|) is:
View SolutionIf f(x)=2x+3andg(x)=9x+6, then find g[f(x)]−f[g(x)]
View Solution
