In Fig. POQ is a line and . Then the value of x is . . . . . . . . . .
 Solution in Punjabi
The correct Answer is:
Step by step video, text & image solution for In Fig. POQ is a line angle POR=4x and angleQOR=2x. Then the value of x is . . . . . . . . . . by Maths experts to help you in doubts & scoring excellent marks in Class 9 exams.
Updated on:21/07/2023Topper's Solved these Questions
- LINES AND ANGLES BOOK - SWAN PUBLICATIONCHAPTER - LINES AND ANGLES EXERCISE - Objective Type Questions (Sate whether the following statements are true (T) or false (F) : )
9 Videos
- LINES AND ANGLES BOOK - SWAN PUBLICATIONCHAPTER - LINES AND ANGLES EXERCISE - Objective Type Questions (Solve the following questions)
2 Videos
- LINES AND ANGLES BOOK - SWAN PUBLICATIONCHAPTER - LINES AND ANGLES EXERCISE - Exercise 6.3
6 Videos
- LINEAR EQUATIONS IN TWO VARIABLES BOOK - SWAN PUBLICATIONCHAPTER - LINEAR EQUATIONS IN TWO VARIABLES EXERCISE - Objective Type Questions (Fill in the Blanks :)
6 Videos
- NUMBER SYSTEMSBOOK - SWAN PUBLICATIONCHAPTER - NUMBER SYSTEMSEXERCISE - OBJECTIVE TYPE QUESTIONS
34 Videos
Similar Questions
If two parallel lines are cut by a transversal then corresponding angles are equal.
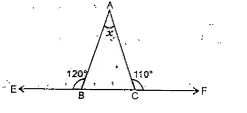
View SolutionIn Fig., find the value of x.

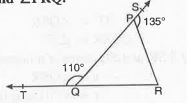
View SolutionIn the given fig.
 , sides QP and RQ of ΔPQR aer produced to points S and T respectively. If ∠SPR=135∘ and ∠PQT=110∘, find ∠PRQ.
View SolutionThe graph of every linear equation on two variables is a . . . . . . . . . . . . .
View SolutionState whether the statement are true (T) or false (F):
Any number which can be written in the form pq, where p and q are integers and q≠0 is called rational number.
View SolutionHow many lines of symmetry does the above figure have ?
View SolutionDetermine the point of symmetry of a regular hexagon.
View SolutionDtermine the images of the following figure about the given line :
View SolutionMatch the following Column A to Column B

View SolutionMatch the following Column A to Column B

View SolutionMatch the following Column A to Column B

View SolutionThe inequation represented by the graph given below is :
View SolutionThe inequation that best describes the graph given below is _________
View SolutionThe inequation that best describes the following graph is _________
View SolutionIn fig. O is the center of the circle. Find the value of x.
ltimg src="https://d10lpgp6xz60nq.cloudfront.net/physics_images/PS_MATH_IX_C12_S01_031_Q01.png" width="80%"gt
View SolutionIn Fig, find the value of x.
ltimg src="https://d10lpgp6xz60nq.cloudfront.net/physics_images/PS_MATH_IX_C12_S01_032_Q01.png" width="80%"gt
View Solution
