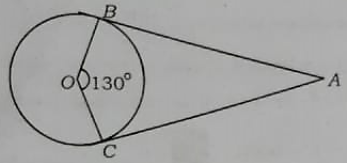
In the figure AB and AC are the two tangents drawn from the point A to the circle with centre O, If AngleBỌC = 130* then find AngleBAC
 Solution in Kannada
The correct Answer is:Hence proved
Step by step video, text & image solution for In the figure AB and AC are the two tangents drawn from the point A to the circle with centre O, If AngleBỌC = 130* then find AngleBAC by Maths experts to help you in doubts & scoring excellent marks in Class 10 exams.
Updated on:21/07/2023Topper's Solved these Questions
- CIRCLES BOOK - CPC CAMBRIDGE PUBLICATIONCHAPTER - CIRCLES EXERCISE - EXERCISE 4.1 FILL in the blanks :
4 Videos
- ARITHMETIC PROGRESSIONSBOOK - CPC CAMBRIDGE PUBLICATIONCHAPTER - ARITHMETIC PROGRESSIONSEXERCISE - EXERCISE 1.4
5 Videos
- CO-ORDINATE GEOMETRYBOOK - CPC CAMBRIDGE PUBLICATIONCHAPTER - CO-ORDINATE GEOMETRYEXERCISE - EXERCISE 7.4
6 Videos
Similar Questions
A tangents to a circle intersects it in only one points (s)
View SolutionWhich term of the A.P : 121, 117, 113, ………………. Is the first negative term ?
View SolutionDetermine the ratio in which the line 2x + y - 4 = 0 divides the line segment joining the points A(2, -2) and B(3, 7).

View SolutionIn the given figure (not to scale), O is the centre of the circle. A,B,C and D are concyclic and AB=CD . If /_MON =120^(@) , then find /_ OPN .
View SolutionDetermine the point of symmetry of a regular hexagon.
View SolutionDtermine the images of the following figure about the given line :
View SolutionIn the figure above (not to scale), ¯¯¯¯¯¯AB⊥¯¯¯¯¯¯CDandAD is the bisector of ∠BAE.AB=3cm and AC=5cm. Find CD.
View SolutionIn the given figure, AB is a diameter, O is the center of the circle and ∠OCB=50∘ then find ∠DBC.
View SolutionMatch the following Column A to Column B

View SolutionMatch the following Column A to Column B

View SolutionMatch the following Column A to Column B

View SolutionFind the area of figure given below.

View SolutionFind the perimeter of the figure given below.

View SolutionFind the area of the figure given below.

View SolutionThe inequation represented by the graph given below is :
View SolutionThe inequation that best describes the graph given below is _________
View Solution
