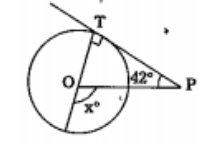
In the figure PT is a tangent to the circle with centre 'O' then x =
 Solution in Telugu
148∘
58∘
52∘
42∘
The correct Answer is:D
Step by step video & image solution for In the figure PT is a tangent to the circle with centre 'O' then x = by Maths experts to help you in doubts & scoring excellent marks in Class 10 exams.
Updated on:21/07/2023Topper's Solved these Questions
- TANGENT AND SECANTS TO A CIRCLE BOOK - VGS PUBLICATION-BRILLIANTCHAPTER - TANGENT AND SECANTS TO A CIRCLE EXERCISE - CREATIVE QUESTIONS FOR CCE MODEL EXAMINATION GIVEN IN THE PUBLE EXAMINATION (PART-B)
20 Videos
- SUMMATIVE ASSESSMENTBOOK - VGS PUBLICATION-BRILLIANTCHAPTER - SUMMATIVE ASSESSMENTEXERCISE - SUMMATIVE ASSESSMENT
61 Videos
- TANGENTS AND SECANTS TO A CIRCLEBOOK - VGS PUBLICATION-BRILLIANTCHAPTER - TANGENTS AND SECANTS TO A CIRCLEEXERCISE - EXERCISE
201 Videos
Similar Questions
The maximum nuber of possible tangents that can be draw to a circle is ……..
View SolutionRamu says, "If log10x=0, value of x=0". Do you agree with him ? Give reason.
View SolutionDraw a circle with any radius . Draw four tangents at different points . How many tangents can you draw to this circle ?
View SolutionIn the given figure (not to scale), O is the centre of the circle. A,B,C and D are concyclic and AB=CD . If /_MON =120^(@) , then find /_ OPN .
View SolutionHow many lines of symmetry does the above figure have ?
View SolutionDetermine the point of symmetry of a regular hexagon.
View SolutionDtermine the images of the following figure about the given line :
View SolutionIn the given figure, AB is a diameter, O is the center of the circle and ∠OCB=50∘ then find ∠DBC.
View SolutionMatch the following Column A to Column B

View SolutionMatch the following Column A to Column B

View SolutionMatch the following Column A to Column B

View SolutionFind the area of figure given below.

View SolutionFind the perimeter of the figure given below.

View SolutionFind the area of the figure given below.

View SolutionThe area of the shaded part in the figure given below is ______.

View SolutionThe inequation represented by the graph given below is :
View Solution
