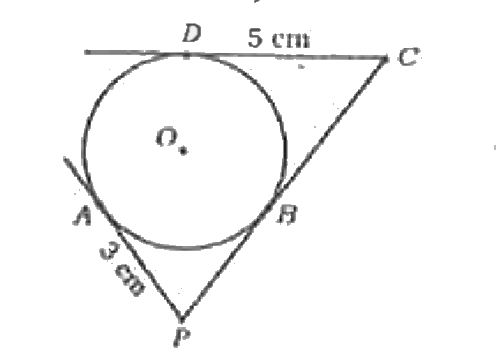
In the following figure, PA, PC and CD are tangents drawn to a circle of centre O, If AP=3cm,CD=5cm, then the length of PC is.
 Solution in Kannada
3 cm
5 cm
8 cm
2 cm
The correct Answer is:C
Step by step video, text & image solution for In the following figure, PA, PC and CD are tangents drawn to a circle of centre O, If AP= 3cm, CD=5 cm, then the length of PC is. by Maths experts to help you in doubts & scoring excellent marks in Class 12 exams.
Updated on:21/07/2023Topper's Solved these Questions
- ANNUAL EXAMINATION QUESTION PAPER JUNE-2019 (WITH ANSWERS)BOOK - SUBHASH PUBLICATIONCHAPTER - ANNUAL EXAMINATION QUESTION PAPER JUNE-2019 (WITH ANSWERS)EXERCISE - EXERCISE
38 Videos
- ANNUAL EXAMINATION QUESTION PAPER JUN-2019BOOK - SUBHASH PUBLICATIONCHAPTER - ANNUAL EXAMINATION QUESTION PAPER JUN-2019EXERCISE - PART E
4 Videos
- ANNUAL EXAMINATION QUESTION PAPER MAR-2018BOOK - SUBHASH PUBLICATIONCHAPTER - ANNUAL EXAMINATION QUESTION PAPER MAR-2018EXERCISE - PART E
4 Videos
Similar Questions
Write the formula to find the sum of first n terms of an Arithmetic progression, whose first term is a and the last term is an.
View SolutionProve that ∫ba(x)dx=∫baf(a+b−x)dx and ∫π3π4dx1+√tanx.
View SolutionProve that ∫a0f(x)dx=∫a0f(a−x)dx and hence evaluate the following:
(a) ∫a0√x√x+√a−xdx
View SolutionIn the given figure (not to scale), O is the centre of the circle. A,B,C and D are concyclic and AB=CD . If /_MON =120^(@) , then find /_ OPN .
View SolutionHow many lines of symmetry does the above figure have ?
View SolutionDetermine the point of symmetry of a regular hexagon.
View SolutionDtermine the images of the following figure about the given line :
View SolutionIn the figure above (not to scale), ¯¯¯¯¯¯AB⊥¯¯¯¯¯¯CDandAD is the bisector of ∠BAE.AB=3cm and AC=5cm. Find CD.
View SolutionIn the given figure, AB is a diameter, O is the center of the circle and ∠OCB=50∘ then find ∠DBC.
View SolutionMatch the following Column A to Column B

View SolutionMatch the following Column A to Column B

View SolutionMatch the following Column A to Column B

View SolutionThe inequation represented by the graph given below is :
View SolutionThe inequation that best describes the graph given below is _________
View SolutionThe inequation that best describes the following graph is _________
View SolutionWhich inequations represent the shaded region in the given figure
View Solution
