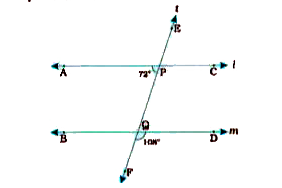
In the following figure, t is the transversal of l and m. If and , prove that .
 Solution in Gujrati
The correct Answer is:angleYXC=115^(@)
Step by step video, text & image solution for In the following figure, t is the transversal of l and m. If angleAPQ=72^(@) and angleDQF=108^(@) , prove that l||m. by Maths experts to help you in doubts & scoring excellent marks in Class 9 exams.
Updated on:21/07/2023Topper's Solved these Questions
- LINE AND ANGLESBOOK - KUMAR PRAKASHANCHAPTER - LINE AND ANGLESEXERCISE - Multiple Choice Questions MCQs)
10 Videos
- LINE AND ANGLESBOOK - KUMAR PRAKASHANCHAPTER - LINE AND ANGLESEXERCISE - Sums of Enrich Remember.s
8 Videos
- INTRODUCTION TO EUCLID'S GEOMETRYBOOK - KUMAR PRAKASHANCHAPTER - INTRODUCTION TO EUCLID'S GEOMETRYEXERCISE - MULTIPLE CHOICE QUESTIONS
3 Videos
- LINEAR EQUATIONS IN TWO VARIABLES BOOK - KUMAR PRAKASHANCHAPTER - LINEAR EQUATIONS IN TWO VARIABLES EXERCISE - Multiple Choice Questions (MCQs)
7 Videos
Similar Questions
The measure of the complementary angle of an angle with measure 40∘ is .............
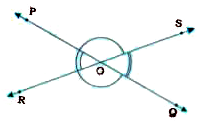
View SolutionIn the given figure, lines PQ and RS intersect each other at point O. If ∠POR:∠ROQ=5:7, find all the angles.

View SolutionThe number of dimensions of a plane is ....... .
View SolutionIf (2,-2) is root of 5x−2y=k, then k = ......
View SolutionHow many lines of symmetry does the above figure have ?
View SolutionWhich of the following are correct chain isomers of butane ? (i)
View SolutionDetermine the point of symmetry of a regular hexagon.
View SolutionDtermine the images of the following figure about the given line :
View SolutionMatch the following Column A to Column B

View SolutionMatch the following Column A to Column B

View SolutionMatch the following Column A to Column B

View SolutionFind the area of the figure given below.

View SolutionThe area of the shaded part in the figure given below is ______.

View SolutionThe inequation represented by the graph given below is :
View SolutionThe inequation that best describes the graph given below is _________
View SolutionThe inequation that best describes the following graph is _________
View Solution
