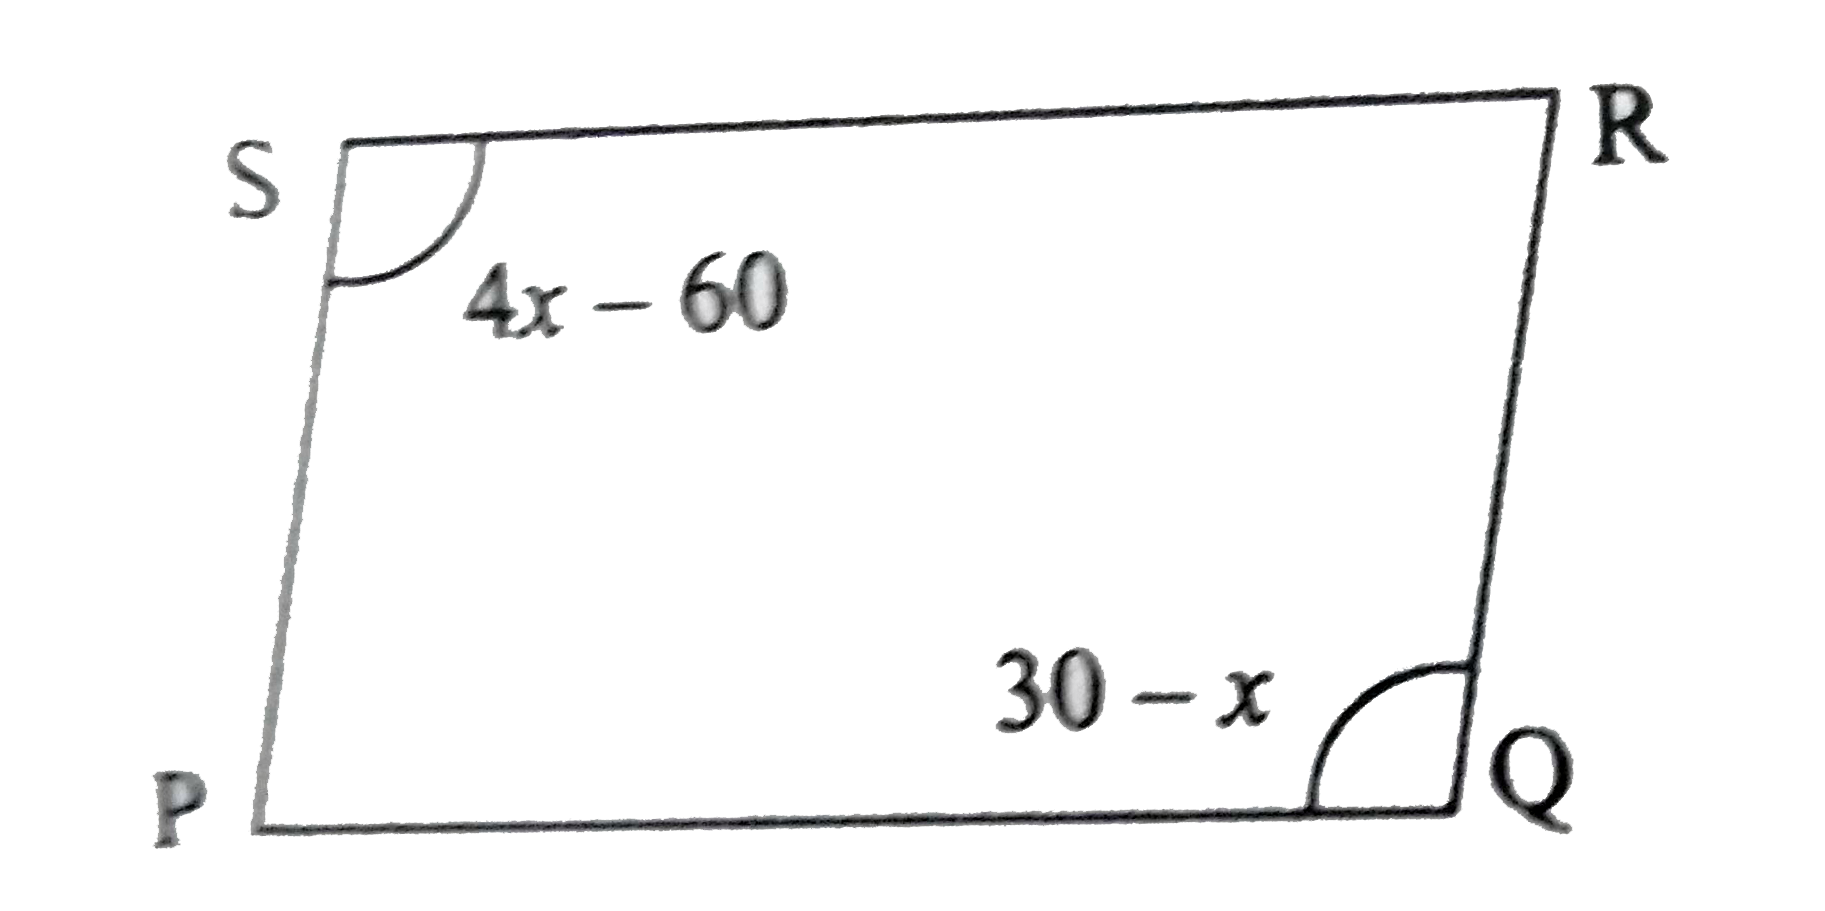
In the given diagram PQRS is a parellelogram.
. Find the angles of P and R .
 Solution in Tamil
The correct Answer is:
Step by step video, text & image solution for In the given diagram PQRS is a parellelogram. angleS=4x-60angleQ=30-x. Find the angles of P and R . by Maths experts to help you in doubts & scoring excellent marks in Class 9 exams.
Updated on:21/07/2023Topper's Solved these Questions
- GEOMETRYBOOK - FULL MARKSCHAPTER - GEOMETRYEXERCISE - Assignment (III. Fill in the blanks )
5 Videos
- COORDINATE GEOMETRYBOOK - FULL MARKSCHAPTER - COORDINATE GEOMETRYEXERCISE - TEXTBOOK ACTIVITY
2 Videos
- MENSURATION BOOK - FULL MARKSCHAPTER - MENSURATION EXERCISE - Assignment (II. Answer the following questions)
8 Videos
Similar Questions
The diagonals of rhombus bisect each other at . . . . . . .
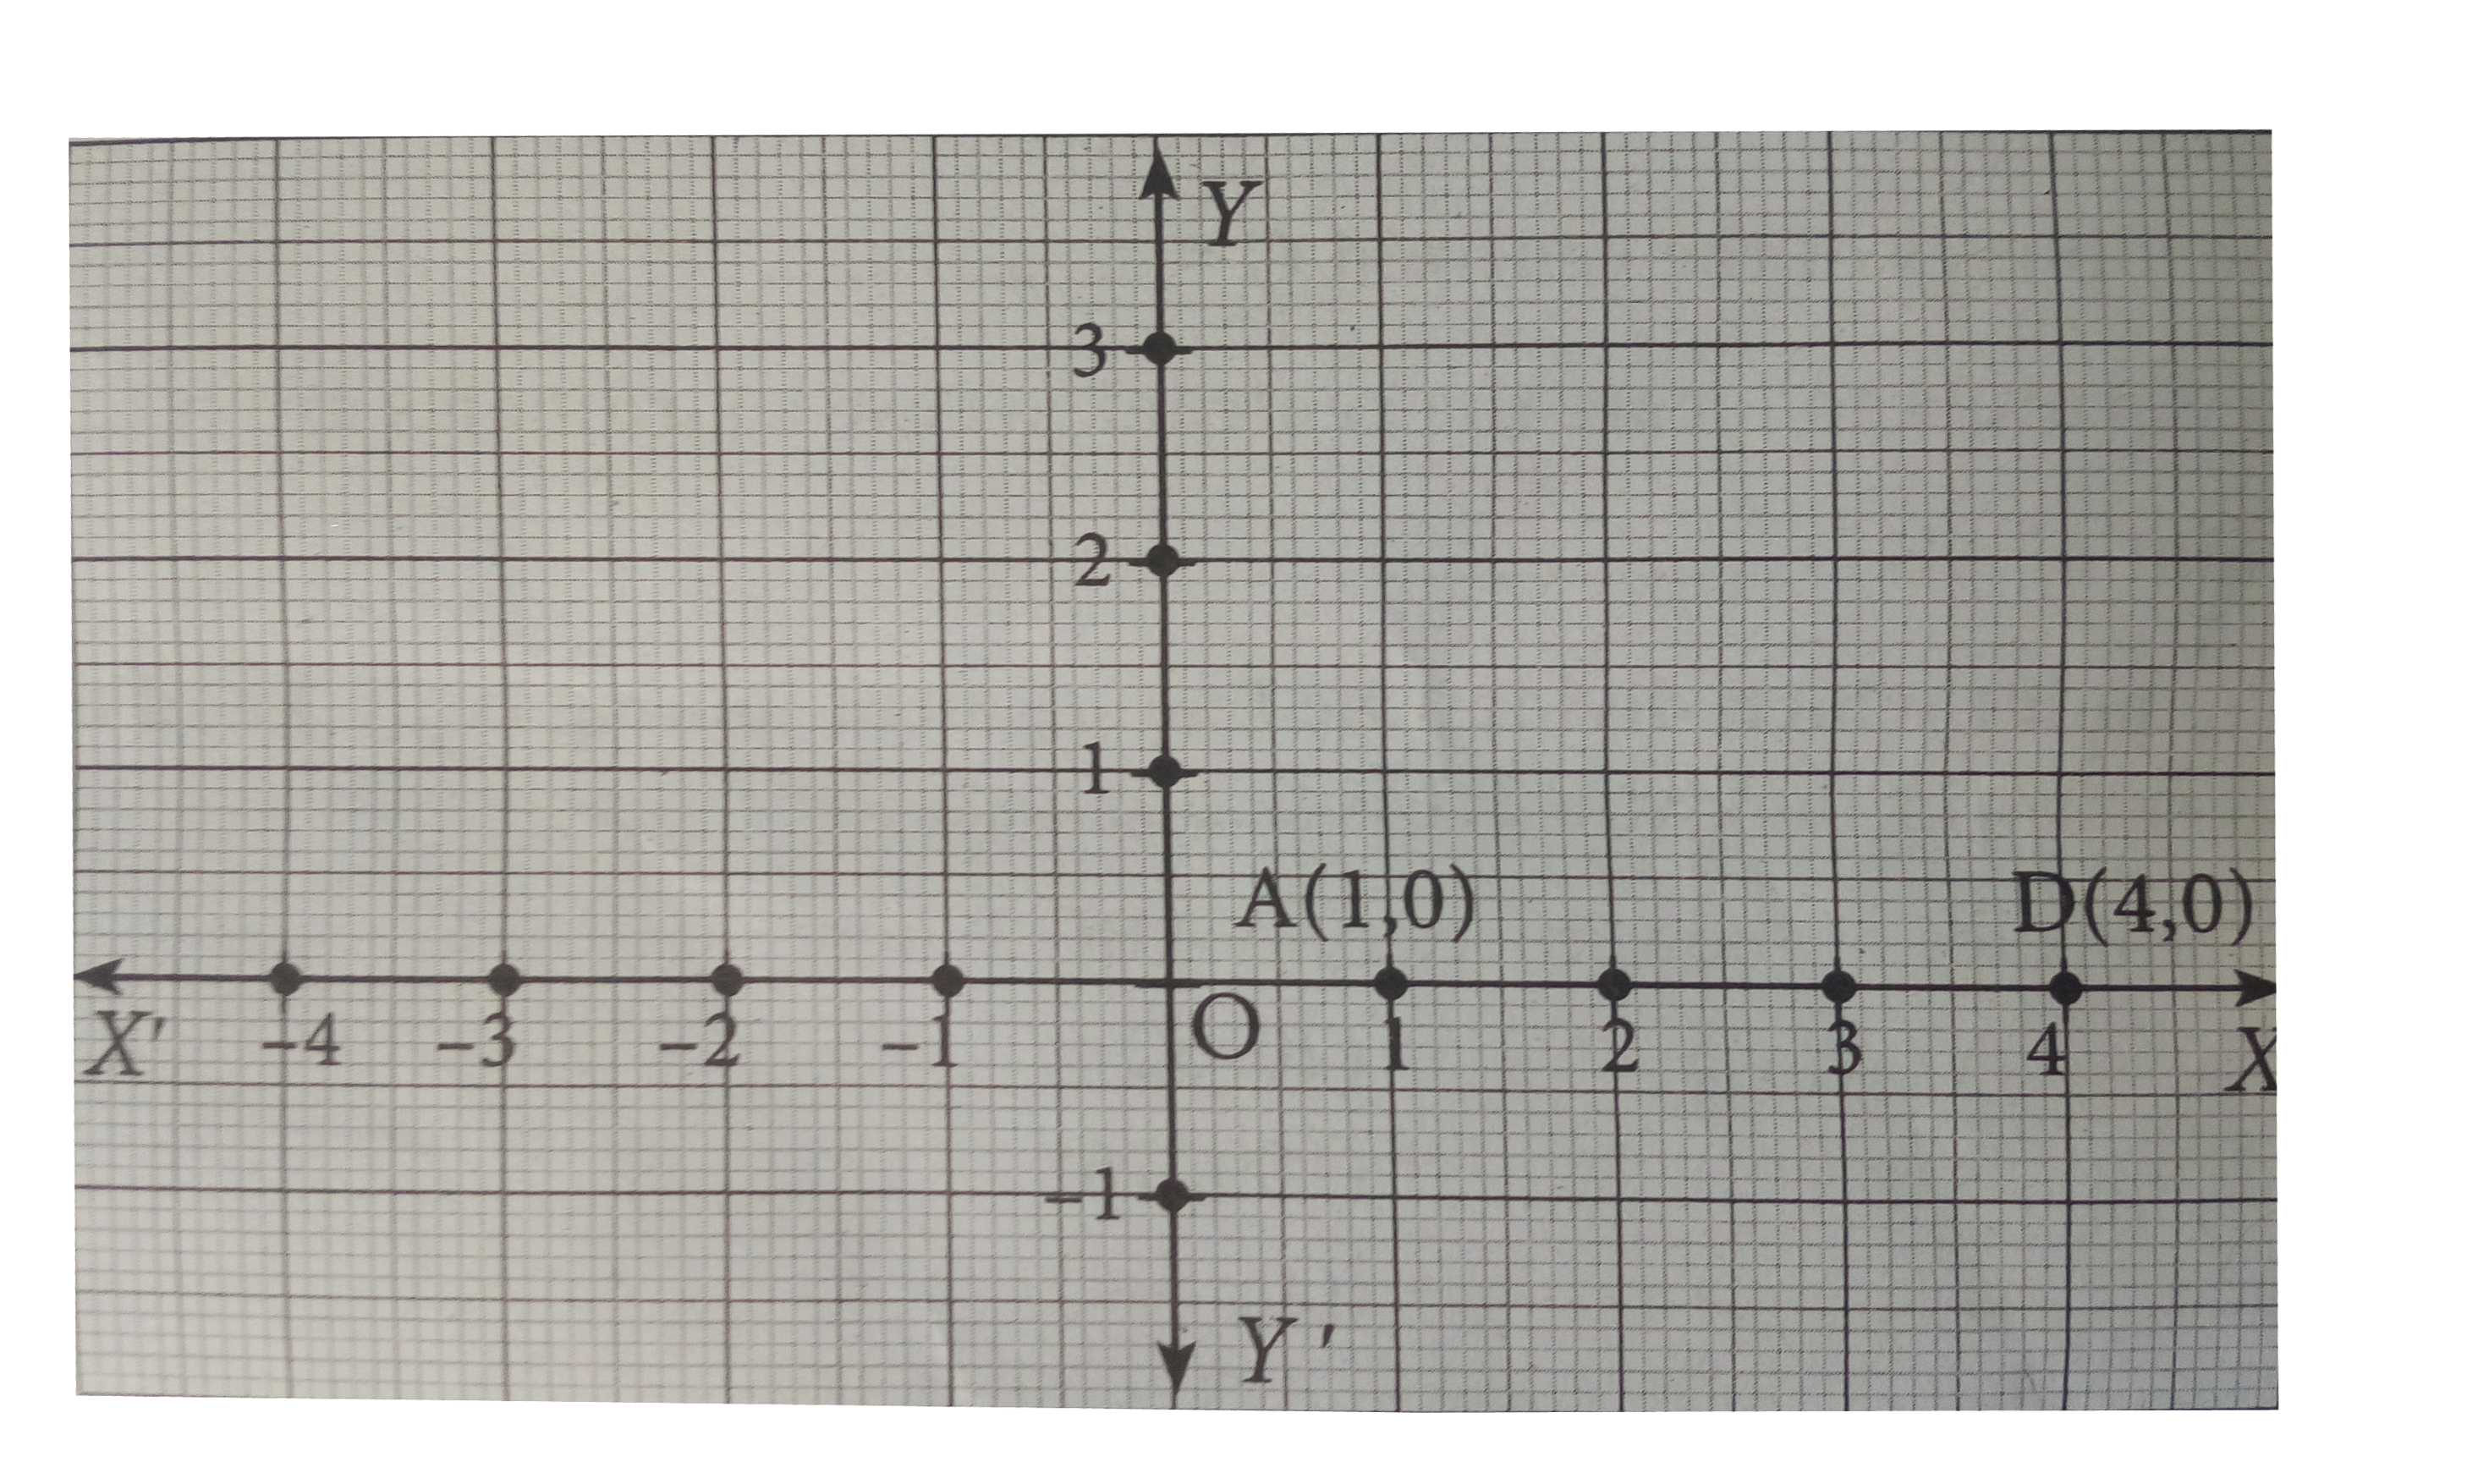
View SolutionPlot the following points on a graph sheet by taking the scale as 1cm=1 unit.
Find how far the points are from each other?
A(1,0) and D(4,0). Find AD and also DA.
Is AD=DA?
You plot another set of points and verify your Result.

View SolutionFind the area of a quadrilateral ABCD where AB = 7 cm, DA = 15 cm, AC = 9 cm, BC = 6 cm and CD = 12 cm.
View SolutionDetermine the point of symmetry of a regular hexagon.
View SolutionDtermine the images of the following figure about the given line :
View SolutionIn the given figure, AB is a diameter, O is the center of the circle and ∠OCB=50∘ then find ∠DBC.
View SolutionMatch the following Column A to Column B

View SolutionMatch the following Column A to Column B

View SolutionMatch the following Column A to Column B

View SolutionFind the area of figure given below.

View SolutionFind the perimeter of the figure given below.

View SolutionFind the area of the figure given below.

View SolutionThe inequation represented by the graph given below is :
View SolutionThe inequation that best describes the graph given below is _________
View SolutionThe inequation that best describes the following graph is _________
View SolutionWhich inequations represent the shaded region in the given figure
View Solution
