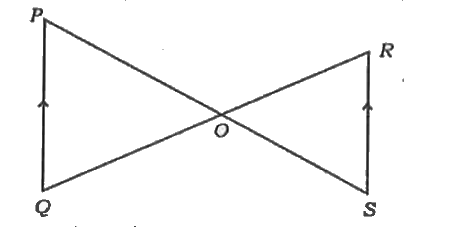
In the given figure PQ ∣∣ RS , prove that ΔPOQ~ΔSOR.
 Solution in Kannada
Step by step video & image solution for In the given figure PQ || RS , prove that Delta POQ~Delta SOR. by Maths experts to help you in doubts & scoring excellent marks in Class 10 exams.
Updated on:21/07/2023Topper's Solved these Questions
- S.S.L.C ANNUAL EXAMINATION QUESTION PAPER MARCH- 2019 ( WITH ANSWERS )BOOK - SUBHASH PUBLICATIONCHAPTER - S.S.L.C ANNUAL EXAMINATION QUESTION PAPER MARCH- 2019 ( WITH ANSWERS )EXERCISE - II. Answer the following
38 Videos
- REAL NUMBERBOOK - SUBHASH PUBLICATIONCHAPTER - REAL NUMBEREXERCISE - EXERCISE 8.4
19 Videos
- SOME APPLICATIONS OF TRIGONOMETRY BOOK - SUBHASH PUBLICATIONCHAPTER - SOME APPLICATIONS OF TRIGONOMETRY EXERCISE - EXERCISE 9.1
16 Videos
Similar Questions
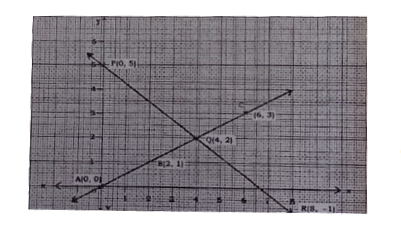
The given graph represents a pair of linear equations in two varibles . Write how many solutions these pair of equations have .

View SolutionWithout actually performing the long division state whether the following rational numbers will have a terminating decimal expansion or a non-terminating repeating decimal expansion
133125
View SolutionA circus artist is climbing a 20m long rope, which is tightly stretched and tied from the top of a vertical pole to the ground.Find the height of the pole, if the angle made by the rope with the ground levelis 30∘ ( see Figure)
View SolutionHow many lines of symmetry does the above figure have ?
View SolutionDetermine the point of symmetry of a regular hexagon.
View SolutionDtermine the images of the following figure about the given line :
View SolutionMatch the following Column A to Column B

View SolutionMatch the following Column A to Column B

View SolutionMatch the following Column A to Column B

View SolutionFind the area of figure given below.

View SolutionFind the perimeter of the figure given below.

View SolutionFind the area of the figure given below.

View SolutionThe area of the shaded part in the figure given below is ______.

View SolutionThe inequation represented by the graph given below is :
View SolutionThe inequation that best describes the graph given below is _________
View SolutionThe inequation that best describes the following graph is _________
View Solution
