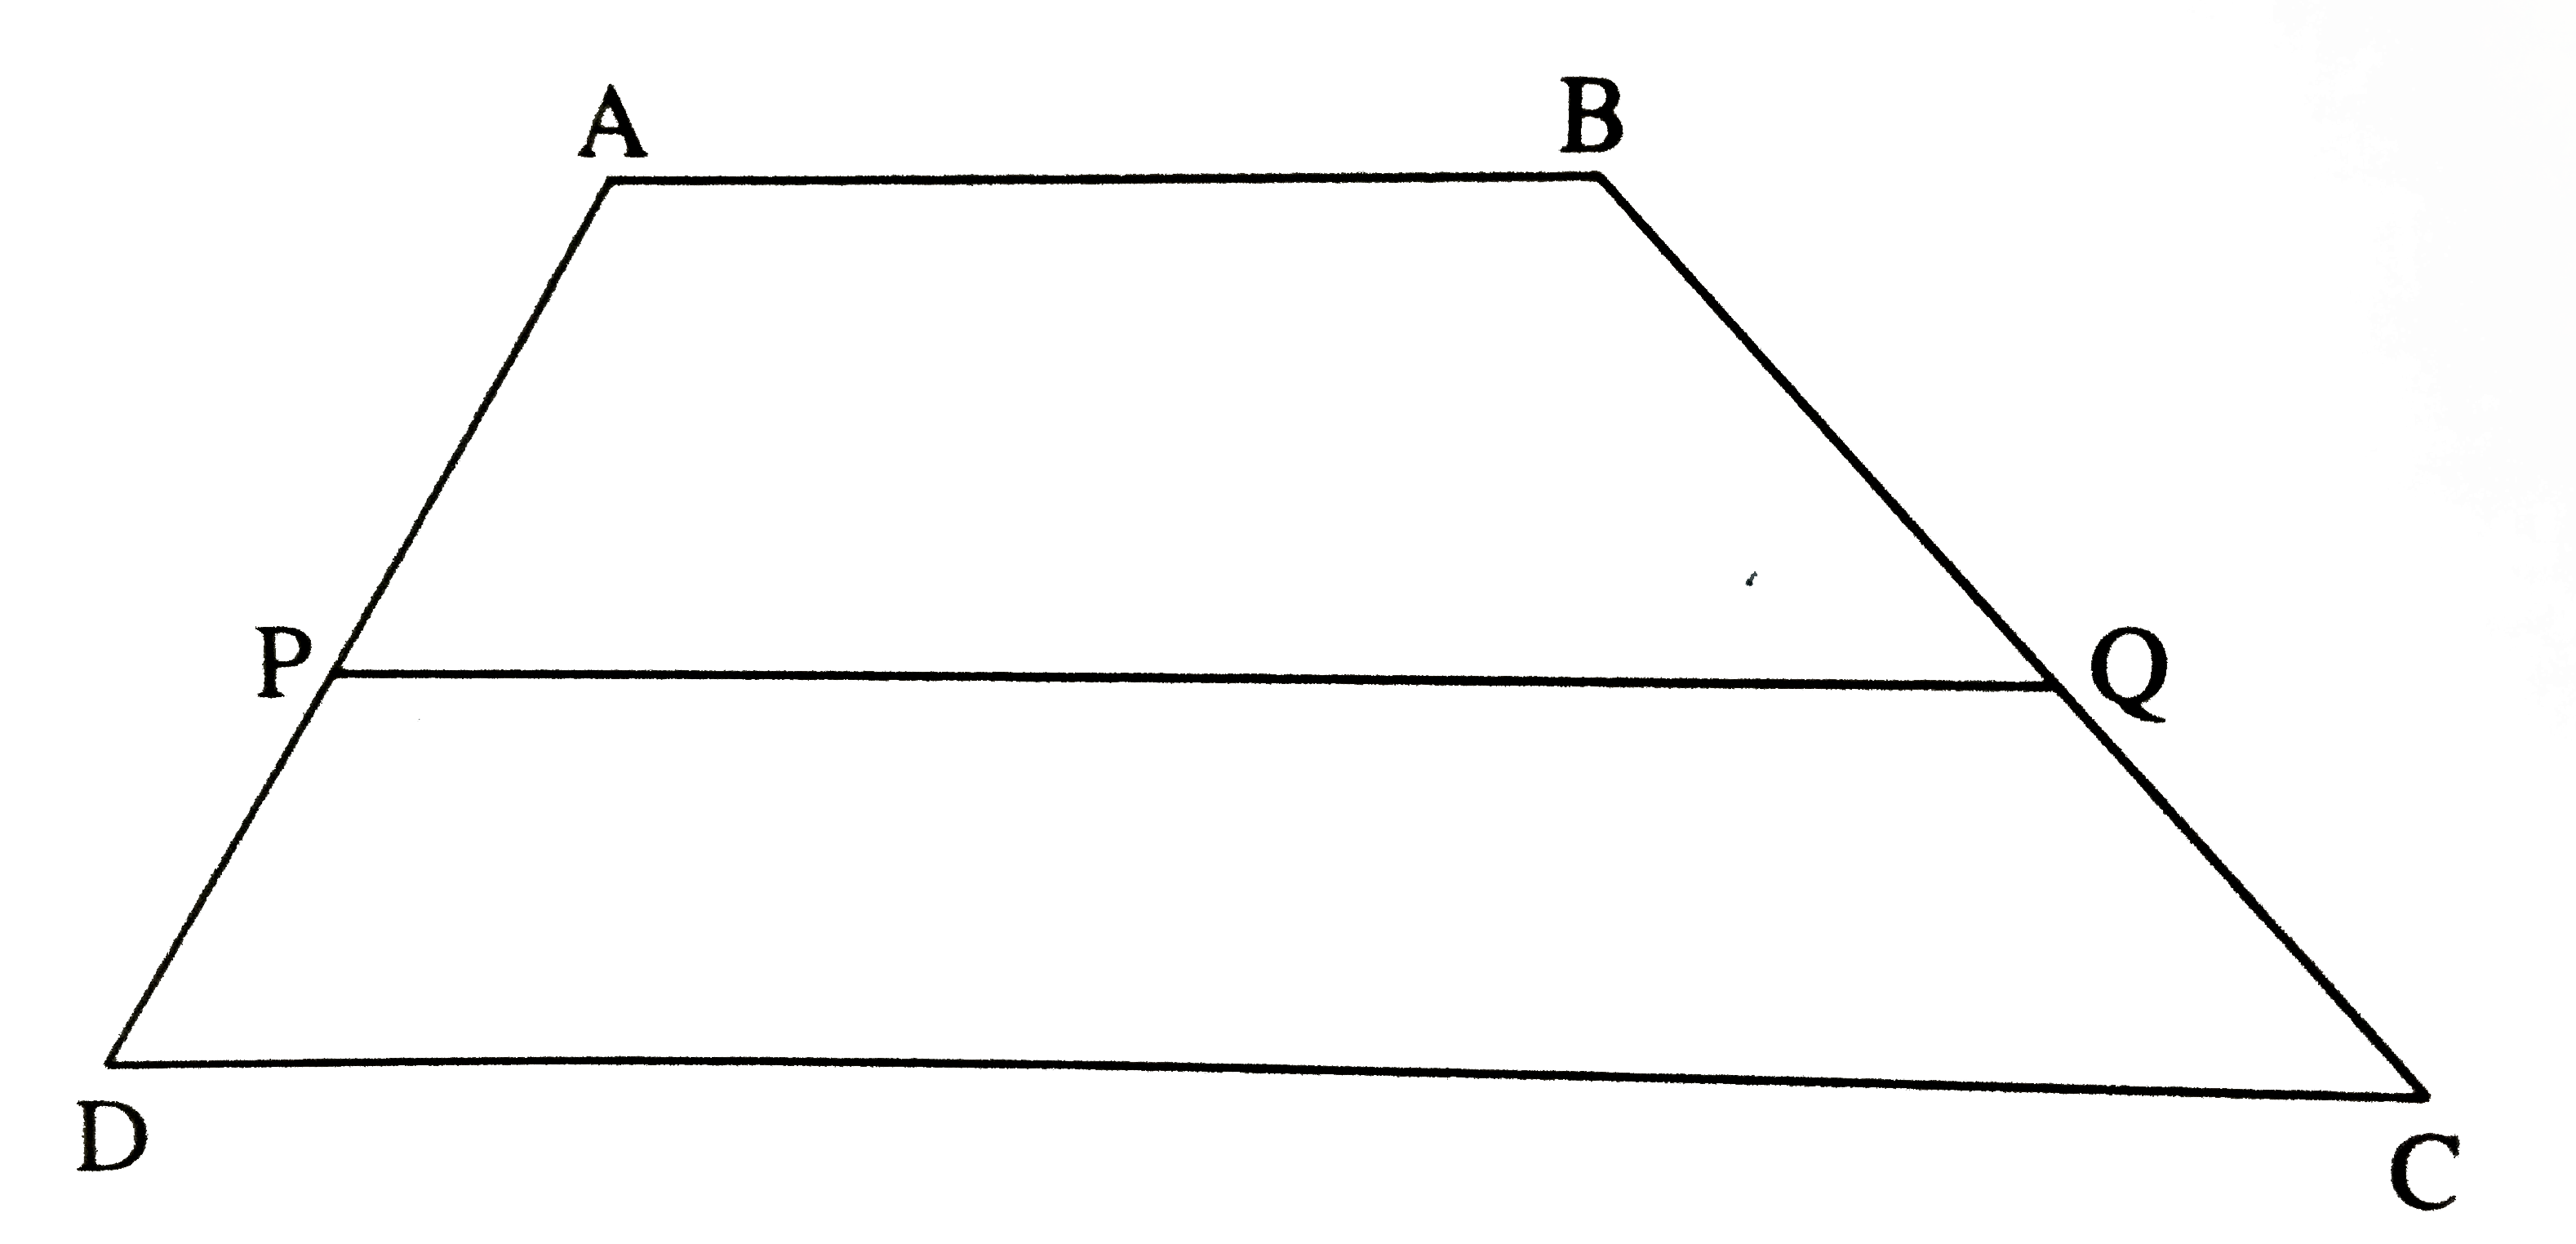
In trapezium ABCD side AB∣∣ side PQ∣∣ side DC,
AP=15,PD=12,QC=14, find BQ.
 Solution in Marathi
The correct Answer is:QP = 17.5
Step by step video, text & image solution for In trapezium ABCD side AB|| side PQ|| side DC, AP=15, PD=12, QC=14, find BQ. by Maths experts to help you in doubts & scoring excellent marks in Class 10 exams.
Updated on:21/07/2023Topper's Solved these Questions
- SIMILARITY BOOK - BAL BHARTICHAPTER - SIMILARITY EXERCISE - PRACTICE SET 1.3
7 Videos
- SIMILARITY BOOK - BAL BHARTICHAPTER - SIMILARITY EXERCISE - PRACTICE SET 1.4
6 Videos
- SIMILARITY BOOK - BAL BHARTICHAPTER - SIMILARITY EXERCISE - PRACTICE SET 1.1
3 Videos
- QUADRATIC EQUATIONSBOOK - BAL BHARTICHAPTER - QUADRATIC EQUATIONSEXERCISE - Problem Set - 2
27 Videos
- TRIGONOMETRYBOOK - BAL BHARTICHAPTER - TRIGONOMETRYEXERCISE - Problem set 6
18 Videos
Similar Questions
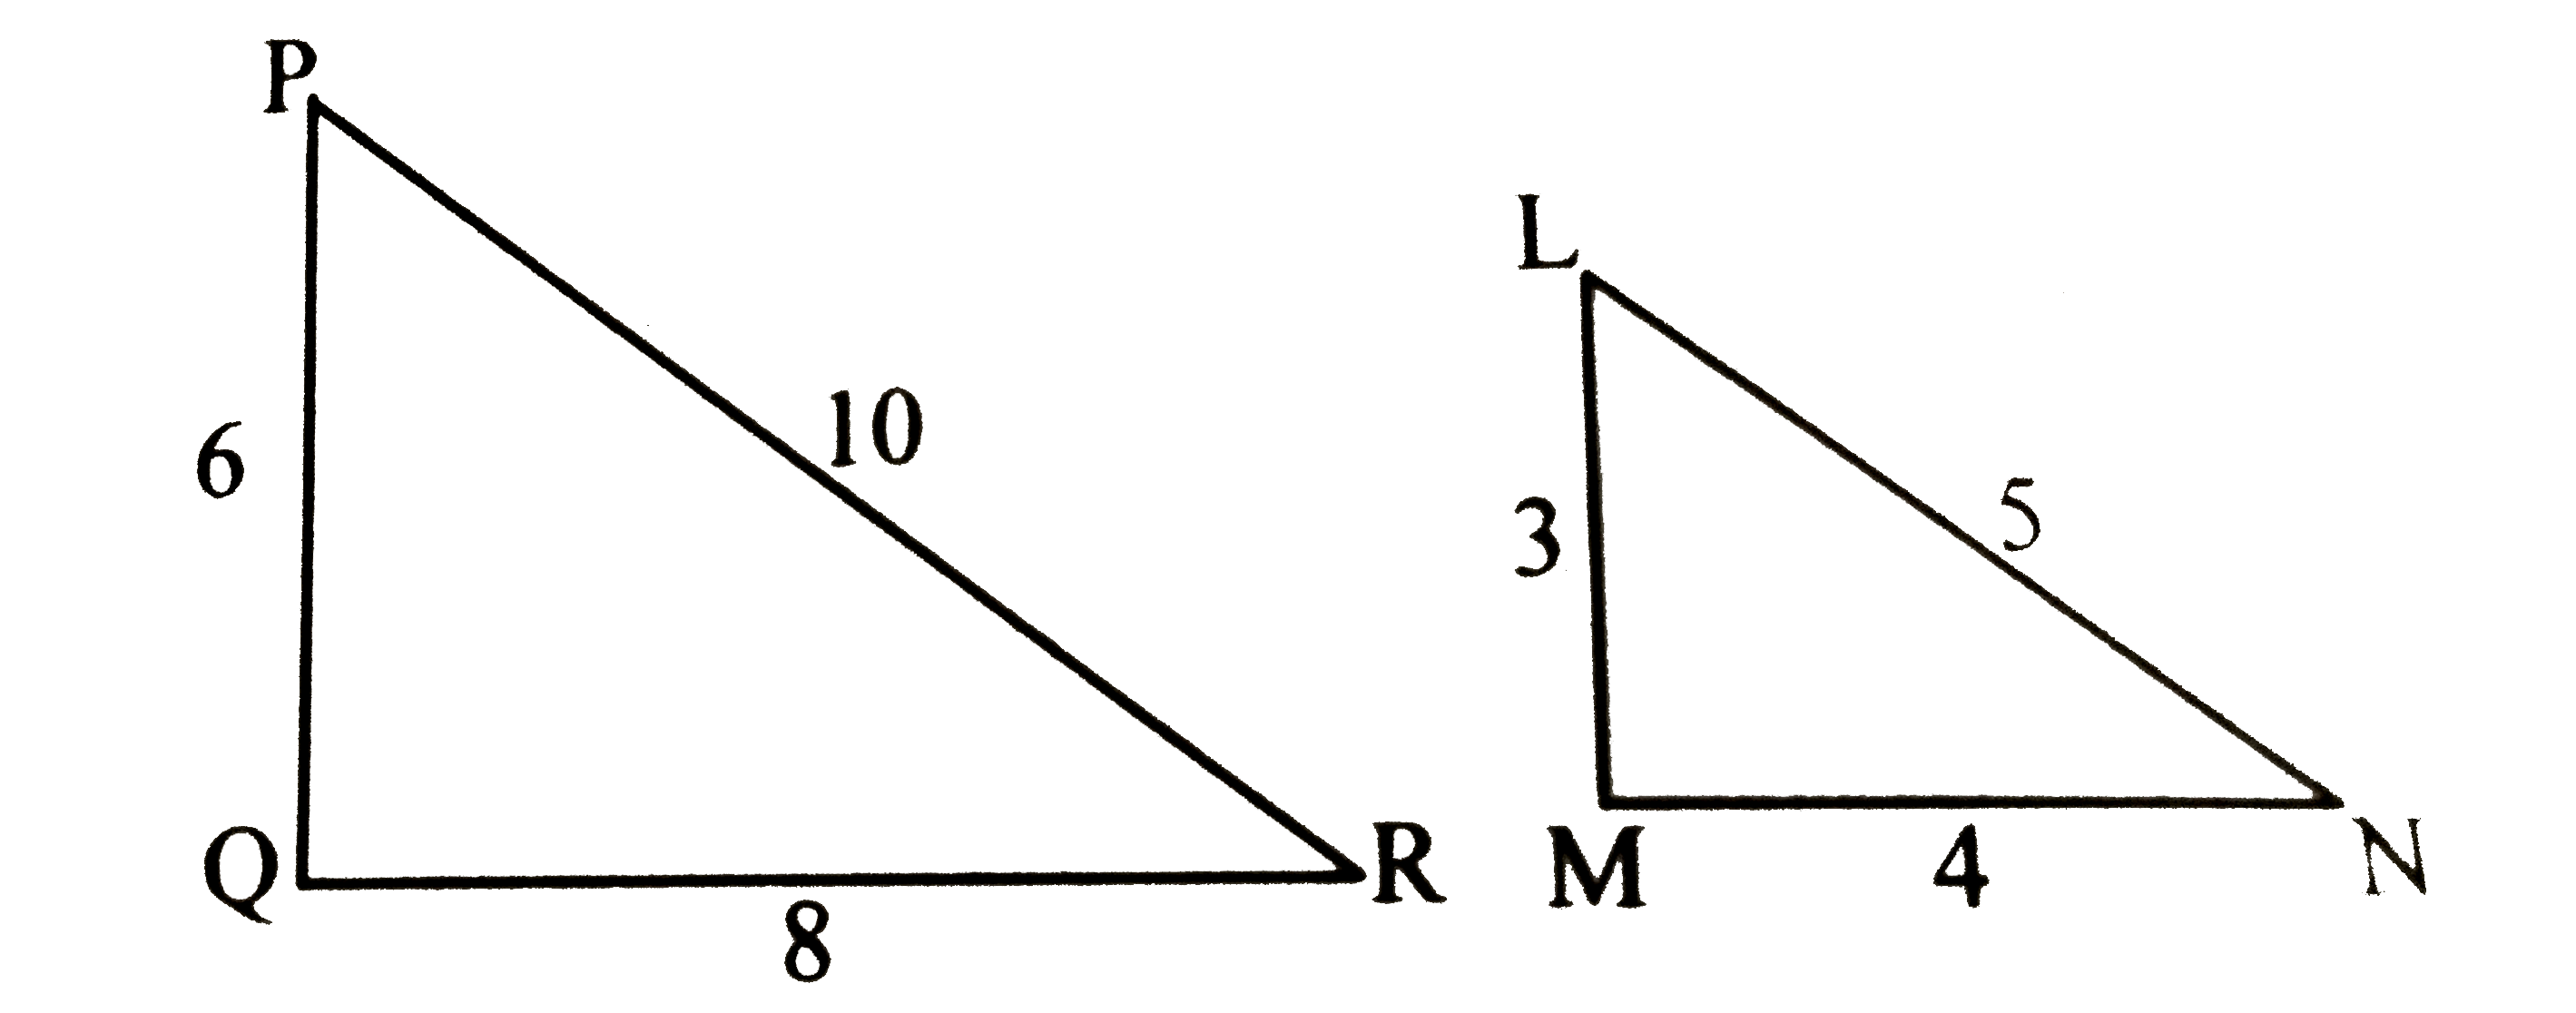
Are the triangle in the adjoining figure similar? If yes, by which test?

View SolutionRatio of corresponding sides of two similar triangles is 3:5, then find ratio of their areas.
View SolutionBase of a triangle is 9 cm and height is 5 cm. Base of another triangle is 10 cm and height is 6 cm. Find the ratio of areas of these triangles.
View SolutionWhich of the following equation is quadratic?
(i) x2+2x+11=0.
View SolutionIf sinθ = 11/61 find the values of cosθ using trigonometric identity.
View SolutionDetermine the point of symmetry of a regular hexagon.
View SolutionIn the following figure (not to scale) , ABCD is an isosecles trapezium. overline(AB)||overline(CD), AB=9cm and CD =12 CM, AP:PD =BQ:QC=1:2 . Find PQ.
View SolutionMatch the following Column A to Column B

View SolutionMatch the following Column A to Column B

View SolutionMatch the following Column A to Column B

View SolutionFind the area of figure given below.

View SolutionFind the perimeter of the figure given below.

View SolutionFind the area of the figure given below.

View SolutionThe inequation represented by the graph given below is :
View SolutionThe inequation that best describes the graph given below is _________
View SolutionThe inequation that best describes the following graph is _________
View Solution
