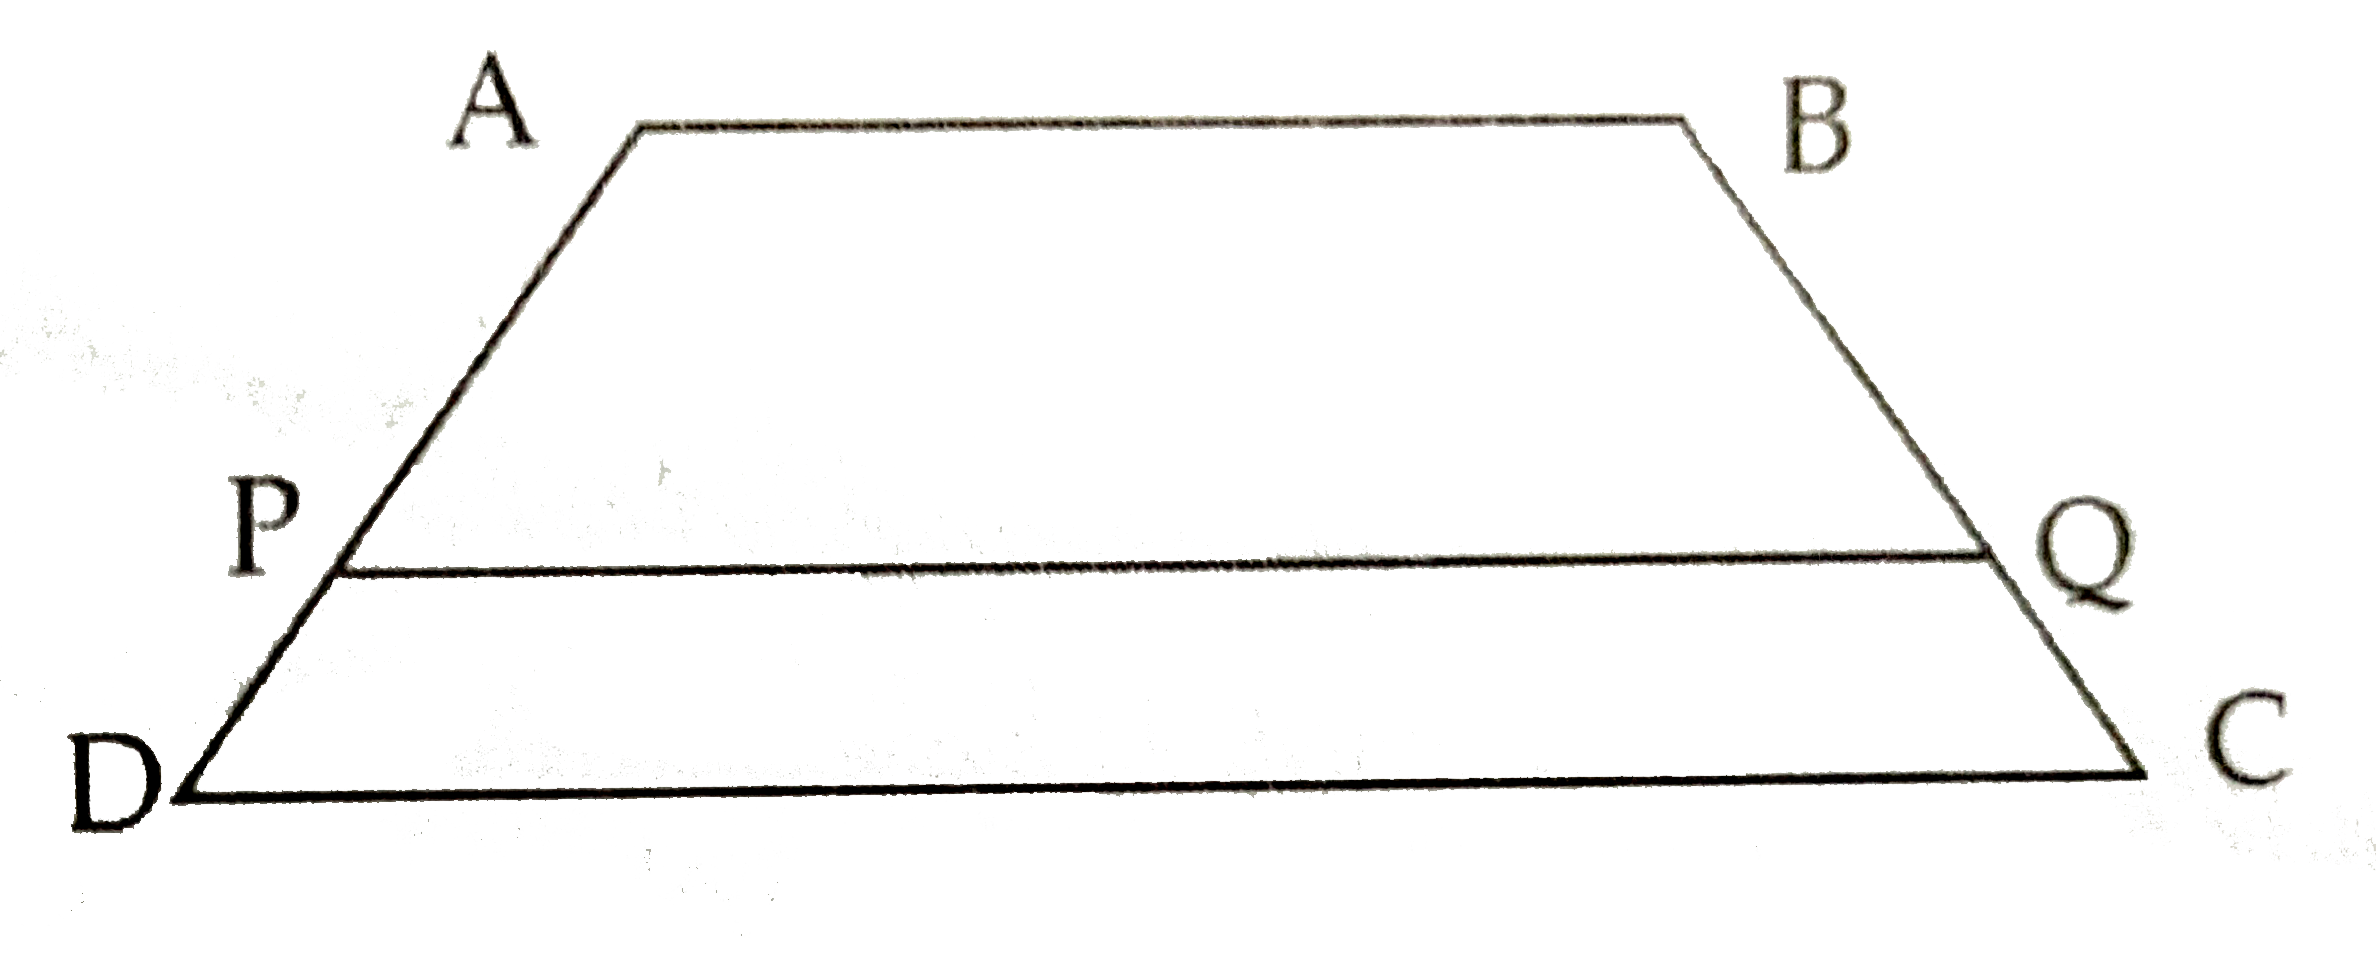
In trapezium ABCD ,side AB||sidePQ||sideDC. AP=15, PD= 12, QC =14. Find BQ.
 Solution in Tamil
The correct Answer is:BQ=17.5 units
Step by step video & image solution for In trapezium ABCD ,side AB||sidePQ||sideDC. AP=15, PD= 12, QC =14. Find BQ. by Maths experts to help you in doubts & scoring excellent marks in Class 10 exams.
Updated on:21/07/2023Topper's Solved these Questions
- SIMILARITY BOOK - CHETAN PUBLICATIONCHAPTER - SIMILARITY EXERCISE - Practice Set - 1.3
9 Videos
- SIMILARITY BOOK - CHETAN PUBLICATIONCHAPTER - SIMILARITY EXERCISE - Practice Set - 1.4
7 Videos
- SIMILARITY BOOK - CHETAN PUBLICATIONCHAPTER - SIMILARITY EXERCISE - Practice Set - 1.1
8 Videos
- QUADRATIC EQUATIONSBOOK - CHETAN PUBLICATIONCHAPTER - QUADRATIC EQUATIONSEXERCISE - ASSIGNMENT
12 Videos
- STANDARD IX SYLLABUS BOOK - CHETAN PUBLICATIONCHAPTER - STANDARD IX SYLLABUS EXERCISE - PROBLEMS FOR PRACTICE
20 Videos
Similar Questions
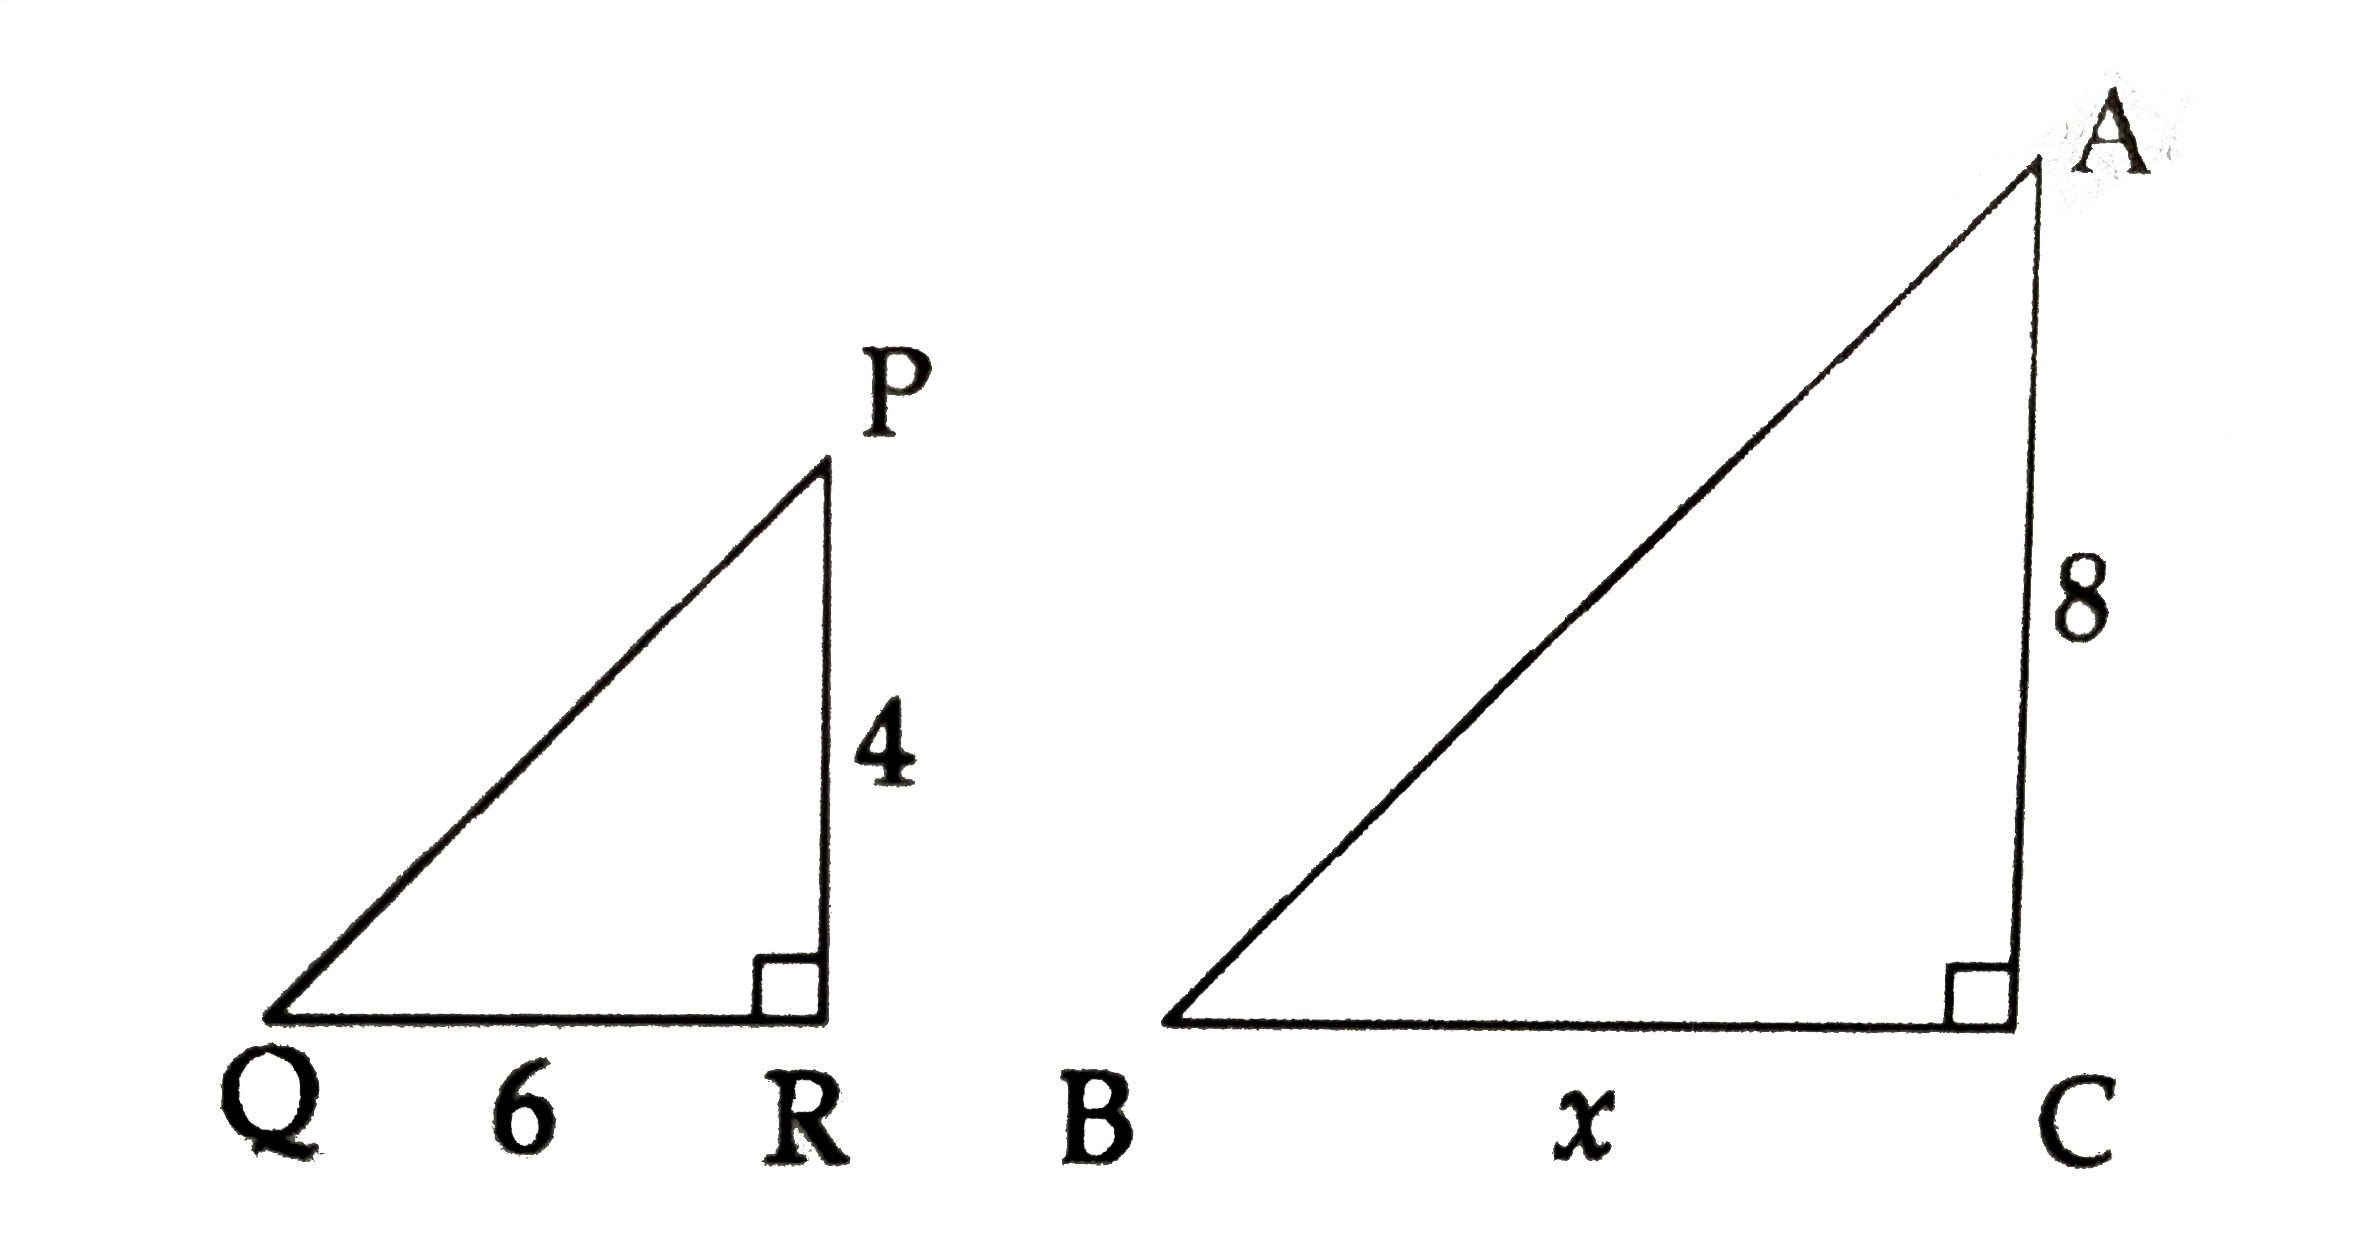
As shown in adjoining figure , two poles of height 8 m and 4 mare perpendicular to ground . If the length of shodow of smaller pole due to sunlight is 6 m then how long will be the shadow of bigger pole at at the same time?

View SolutionIf ΔABC~ΔPQRandAB:AP=2:3 , then fill in the blanks.
A(△ABC)A(△PQR)=(AB)2(PQ)2=2232=□□
View SolutionBase of a triangle is 9 and height is 5. Base of another is 10 and height is 6 . Find the ratio of areas of these triangles.
View SolutionIf α and β are the roots of quadratic equation 2x2+4x+3=0, then the value of α+β=
View SolutionDraw segment PQ=4.3cm and bisect it.
View SolutionDetermine the point of symmetry of a regular hexagon.
View SolutionMatch the following Column A to Column B

View SolutionMatch the following Column A to Column B

View SolutionMatch the following Column A to Column B

View SolutionFind the area of figure given below.

View SolutionFind the perimeter of the figure given below.

View SolutionFind the area of the figure given below.

View SolutionThe inequation represented by the graph given below is :
View SolutionThe inequation that best describes the graph given below is _________
View SolutionThe inequation that best describes the following graph is _________
View Solution
