In which of the following figures does the shaded part represents 0.3 ?


The correct Answer is:A
To determine which figure represents a shaded part of 0.3, we can follow these steps:
Step 1: Identify the Total Parts in Each Figure
- For each figure, count the total number of equal parts (squares, circles, or rectangles) that make up the whole shape.
Step 2: Count the Shaded Parts
- Next, count how many of those parts are shaded in each figure.
Step 3: Calculate the Fraction of Shaded Parts
- For each figure, calculate the fraction of the shaded part by using the formula:
Fraction of Shaded Part=Number of Shaded PartsTotal Parts
Step 4: Convert the Fraction to Decimal
- Convert the fraction obtained in Step 3 into a decimal by dividing the numerator by the denominator.
Step 5: Compare with 0.3
- Finally, compare the decimal value obtained from each figure with 0.3 to determine which figure represents 0.3.
Example Calculation:
1. Figure 1: Total parts = 10, Shaded parts = 3
Fraction=310=0.3
This figure represents 0.3.
2. Figure 2: Total parts = 4, Shaded parts = 1
Fraction=14=0.25
This does not represent 0.3.
3. Figure 3: Total parts = 4, Shaded parts = 1
Fraction=14=0.25
This does not represent 0.3.
4. Figure 4: Total parts = 30, Shaded parts = 12
Fraction=1230=0.4
This does not represent 0.3.
Conclusion:
The only figure that represents 0.3 is the first figure.
---
- For each figure, count the total number of equal parts (squares, circles, or rectangles) that make up the whole shape.
- Next, count how many of those parts are shaded in each figure.
- For each figure, calculate the fraction of the shaded part by using the formula:
Fraction of Shaded Part=Number of Shaded PartsTotal Parts
- Convert the fraction obtained in Step 3 into a decimal by dividing the numerator by the denominator.
- Finally, compare the decimal value obtained from each figure with 0.3 to determine which figure represents 0.3.
1. Figure 1: Total parts = 10, Shaded parts = 3
Fraction=310=0.3
This figure represents 0.3.
Fraction=14=0.25
This does not represent 0.3.
Fraction=14=0.25
This does not represent 0.3.
Fraction=1230=0.4
This does not represent 0.3.
The only figure that represents 0.3 is the first figure.
Topper's Solved these Questions
- DECIMALSBOOK - MTG IIT JEE FOUNDATIONCHAPTER - DECIMALSEXERCISE - EXERCISE( INTEGER / NUMERICAL VALUE TYPE)
10 Videos
- DATA HANDLING BOOK - MTG IIT JEE FOUNDATIONCHAPTER - DATA HANDLING EXERCISE - Olympiad/HOTS Corner
10 Videos
- FRACTIONSBOOK - MTG IIT JEE FOUNDATIONCHAPTER - FRACTIONSEXERCISE - OLYMPIAD /HOTS CORNER
20 Videos
Similar Questions
Knowledge Check
The shaded portion represents.
AA group of professional peopleBA group of Engineers and Professors who are Lawyers
 CA group of Engineers and Lawyers who are also Doctors and Professors a·s well.DNone of these
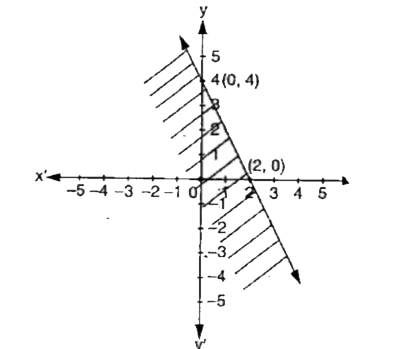
Which of the following inequations represents the shaded region?
 A2x+y≤4B2x+y≥4Cx+2y≤4Dx+2y≥4
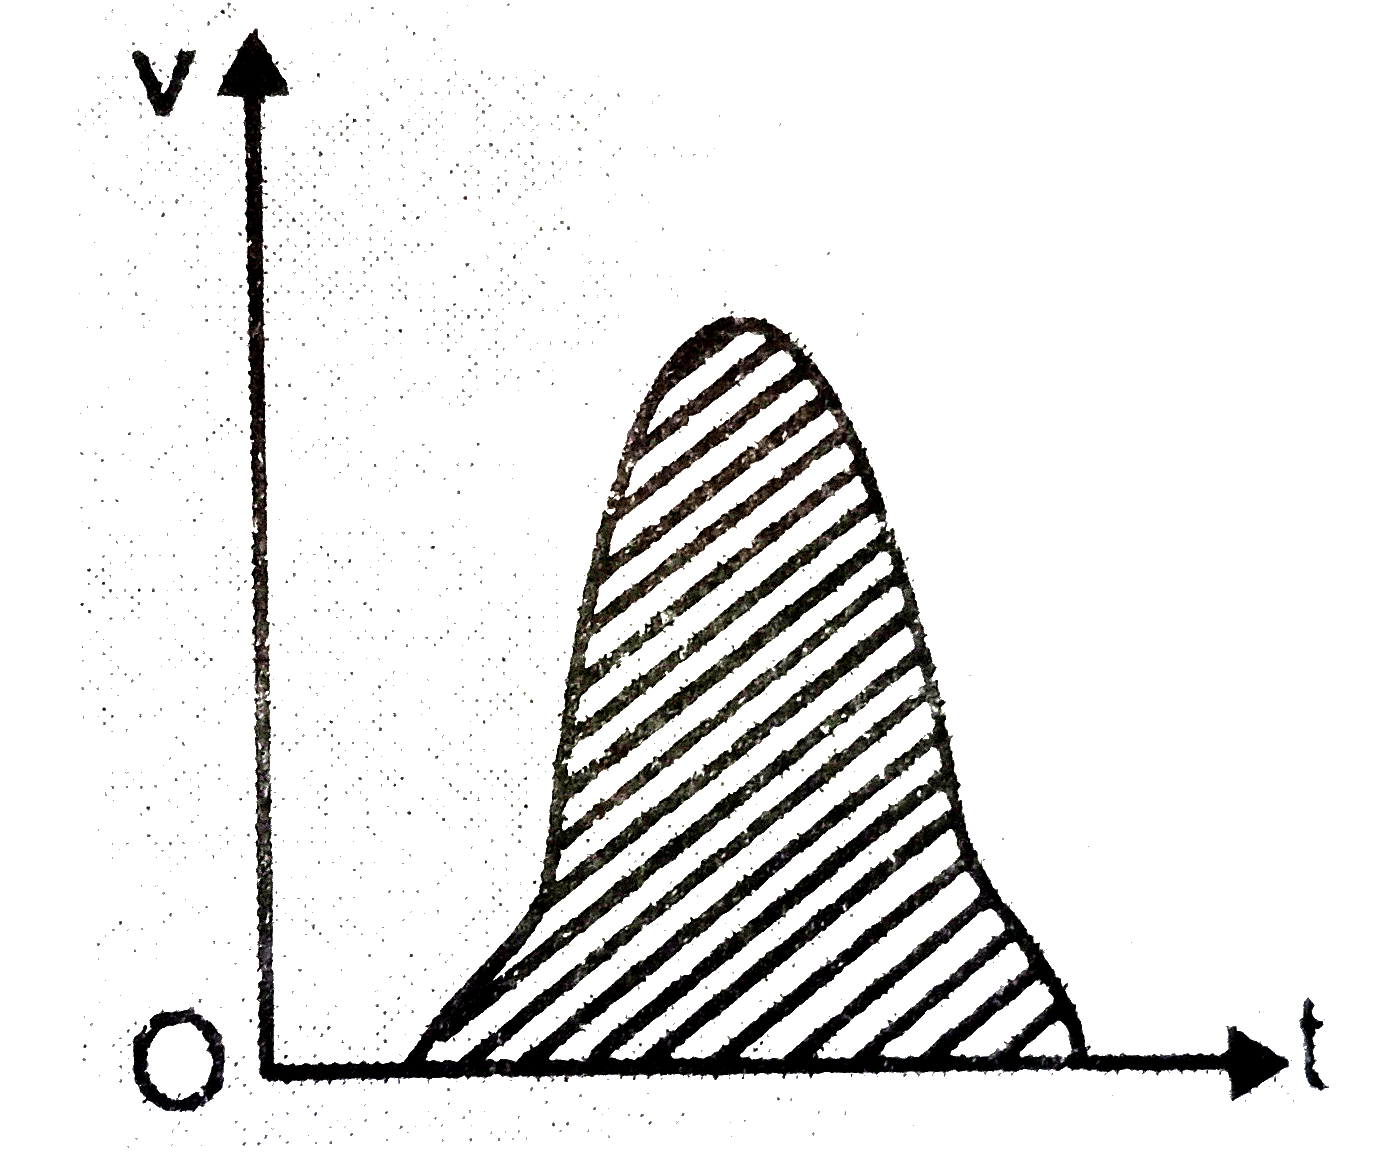
Figure below shows the velocity-time graph of a one dimensional motion. Which of the following characteristic of the particle is represented by the shaded area?
 ASpeedBDisplacementCAccelerationDMomentum
Which of the following does not represent an integer?
View SolutionWhich of the following figures does not represent 1 mole of dioxygen gas at STP ?
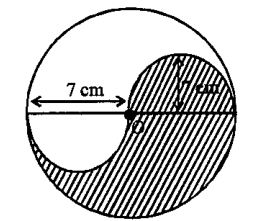
View SolutionIn the following figure, the area of shaded region is

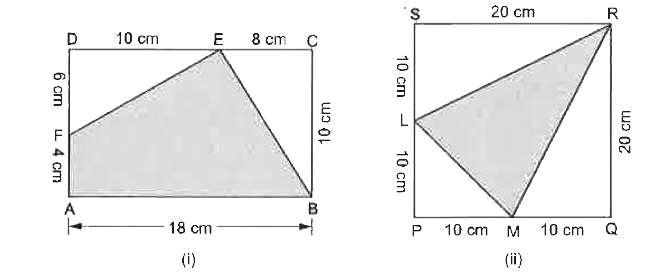
View SolutionIn the diagram give n below shaded part represents :-

View SolutionWhich amongest the following figures doesn't represent the fraction 14 for the shaded part?
View Solution

