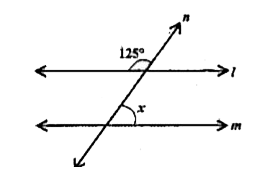
l∣∣m and transversal n intersects them thus value of x will be Solution in Punjabi
125∘
55∘
65∘
75∘
The correct Answer is:B
Step by step video, text & image solution for l ||m and transversal n intersects them thus value of x will be by Maths experts to help you in doubts & scoring excellent marks in Class 7 exams.
Updated on:21/07/2023Topper's Solved these Questions
- LINES AND ANGLES BOOK - SWAN PUBLICATIONCHAPTER - LINES AND ANGLES EXERCISE - OTHER IMPORTANT QUESTIONS (II. Fill in the blanks :)
8 Videos
- LINES AND ANGLES BOOK - SWAN PUBLICATIONCHAPTER - LINES AND ANGLES EXERCISE - OTHER IMPORTANT QUESTIONS (III. State whether the following statements are True or False )
8 Videos
- LINES AND ANGLES BOOK - SWAN PUBLICATIONCHAPTER - LINES AND ANGLES EXERCISE - Exercise 5.2
35 Videos
- INTEGERSBOOK - SWAN PUBLICATIONCHAPTER - INTEGERSEXERCISE - OTHER IMPORTANT QUESTIONS (III. State whether the following statements are true or false : )
8 Videos
- PERIMETER AND AREA BOOK - SWAN PUBLICATIONCHAPTER - PERIMETER AND AREA EXERCISE - OTHER IMPORTANT QUESTIONS (True or False)
8 Videos
Similar Questions
A . . . . . .. . .is a part of a line that has one end points.
View SolutionSum of the measures of two complementary angles is 180∘
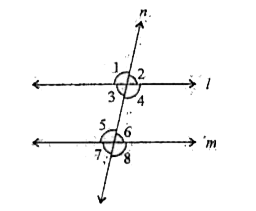
View SolutionIn the figure question identify the pair of angles as corresponding angles, alternate interior angles, ecterior alternate angles, adjacent angles, vertically opposite angles co-interior angles and linear pairs.

∠3 and ∠6
View SolutionZero is an integer which is neither positive nor negative.
View SolutionThe area of a square having side 'a' is 4a square units.
View SolutionHow many lines of symmetry does the above figure have ?
View SolutionWhich of the following are correct chain isomers of butane ? (i)
View SolutionDetermine the point of symmetry of a regular hexagon.
View SolutionDtermine the images of the following figure about the given line :
View SolutionMatch the following Column A to Column B

View SolutionMatch the following Column A to Column B

View SolutionMatch the following Column A to Column B

View SolutionThe inequation represented by the graph given below is :
View SolutionThe inequation that best describes the graph given below is _________
View SolutionThe inequation that best describes the following graph is _________
View SolutionWhich inequations represent the shaded region in the given figure
View Solution
