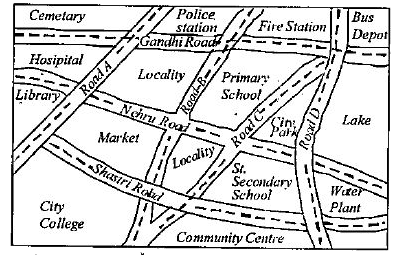
Look at the given map of a city

Answer the following :
Which is further east, the city park or the market? from library to bus depot
Solution in Punjabi
The correct Answer is:City Park
Step by step video, text & image solution for Look at the given map of a city Answer the following : Which is further east, the city park or the market? from library to bus depot by Maths experts to help you in doubts & scoring excellent marks in Class 8 exams.
Updated on:21/07/2023Topper's Solved these Questions
- VISUALISING SOLID SHAPESBOOK - NAND LAL PUBLICATIONCHAPTER - VISUALISING SOLID SHAPESEXERCISE - EXERCISE 10.3
16 Videos
- VISUALISING SOLID SHAPESBOOK - NAND LAL PUBLICATIONCHAPTER - VISUALISING SOLID SHAPESEXERCISE - ADDITIONAL QUESTIONS FOR PRACTICE (Objective Type Questions)
24 Videos
- VISUALISING SOLID SHAPESBOOK - NAND LAL PUBLICATIONCHAPTER - VISUALISING SOLID SHAPESEXERCISE - THINK, DISCUSS AND WRITE
1 Videos
- UNDERSTANDING QUADRILATERALS BOOK - NAND LAL PUBLICATIONCHAPTER - UNDERSTANDING QUADRILATERALS EXERCISE - SAMPLE PAPER FOR PRACTICE
21 Videos
Similar Questions
Can a polyhedron have for its faces: 3 triangles?
View SolutionFill in the blanks.
A _________ depicts the location of a particular object or a place in relation to other objects or places.
View SolutionWhat happen to F, V and E. If some parts are sliced off from a solid? (To start with you may take a Plasticine cube, cut a corner off and investigate).
View SolutionCorrect the statements given below .
Parallel sides of the isosceles trapezium are equal .
View SolutionWhich of the following are correct chain isomers of butane ? (i)
View SolutionDetermine the point of symmetry of a regular hexagon.
View SolutionDtermine the images of the following figure about the given line :
View SolutionMatch the following Column A to Column B

View SolutionMatch the following Column A to Column B

View SolutionMatch the following Column A to Column B

View SolutionThe inequation represented by the graph given below is :
View SolutionThe inequation that best describes the graph given below is _________
View SolutionThe inequation that best describes the following graph is _________
View SolutionWhich inequations represent the shaded region in the given figure
View SolutionFrom the following figure, the correct observation is :- ltimg src="https://d10lpgp6xz60nq.cloudfront.net/physics_images/ALN_PHY_R03_E08_015_Q01.png" width="80%"gt
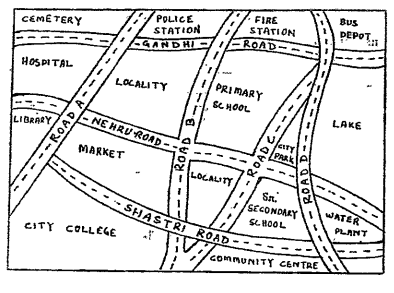
View SolutionLook at the given map of a city.

Answer the following
In red, draw a short street route from Library to the bus depot.
View Solution
