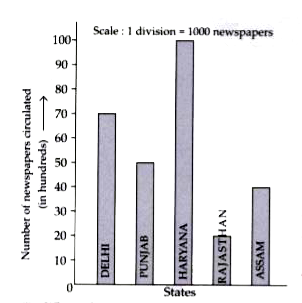
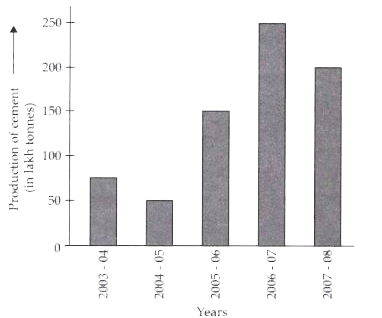
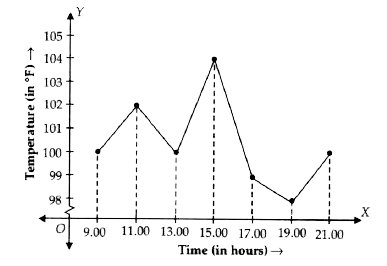
Observe the graph and answer the following questions.
The information given by the graph is:
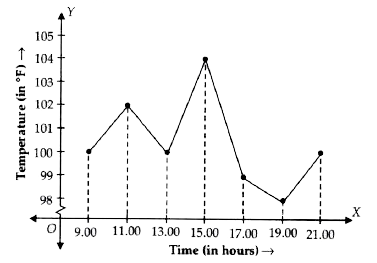
Time - temperature graph
Velocity - time graph
Pressure - volume graph
none of these
The correct Answer is:A
Step by step video & image solution for Observe the graph and answer the following questions. The information given by the graph is: by Maths experts to help you in doubts & scoring excellent marks in Class 8 exams.
Updated on:21/07/2023Topper's Solved these Questions
- INTRODUCTION TO GRAPHS Book:MTG IIT JEE FOUNDATIONChapter:INTRODUCTION TO GRAPHS Exercise:EXERCISE (Multiple Choice Question) (Level-2)
Explore 8 Videos
- INTRODUCTION TO GRAPHS Book:MTG IIT JEE FOUNDATIONChapter:INTRODUCTION TO GRAPHS Exercise:EXERCISE (MATCH THE FOLLOWING
Explore 2 Videos
- INTRODUCTION TO GRAPHS Book:MTG IIT JEE FOUNDATIONChapter:INTRODUCTION TO GRAPHS Exercise:NCERT SECTIONS (15.3)
Explore 4 Videos
- FOOTSTEPS TOWARDS JEE MAINBook:MTG IIT JEE FOUNDATIONChapter:FOOTSTEPS TOWARDS JEE MAINExercise:Section B (Numerical Value Type Questions)
Explore 9 Videos
- LINEAR EQUATIONS IN ONE VARIABLEBook:MTG IIT JEE FOUNDATIONChapter:LINEAR EQUATIONS IN ONE VARIABLEExercise:Olympiad/HOTS Corner
Explore 15 Videos
Similar Questions
Knowledge Check
The bar graph given below shows the spending of a family income on various items and savings during 1993. Observe the graph and answer the following questions :
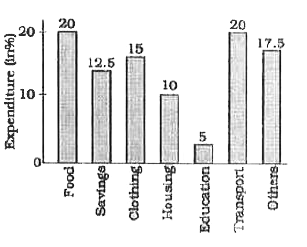
The savings of the family is more than that of expenditure incurred on:AhousingBclothingCtransportDothers
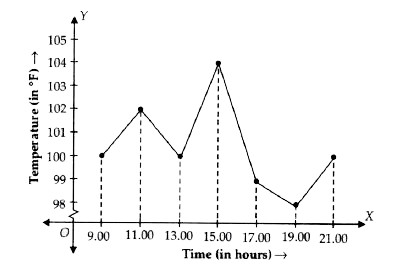
Observe the graph and answer the following questions.
The temperature is minimum at
View SolutionObserve the graph and answer the following questions.
The temperature is maximum at
View SolutionRead the following bar graph and answer the following question: What information is given by the bar graph? In which year the export is minimum? In which year the import is maximum? In which year the difference of the values of export and import is maximum?
View SolutionNumber of wrist watches manufactured by a factory in six days of a particular week is given below.
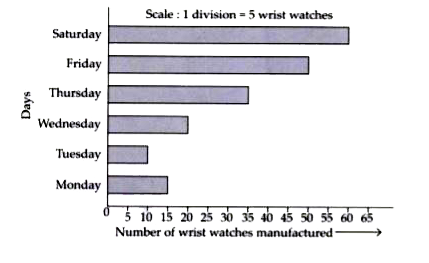
Read the bar graph and answer the following questions.
What information does the bar graph gives ?
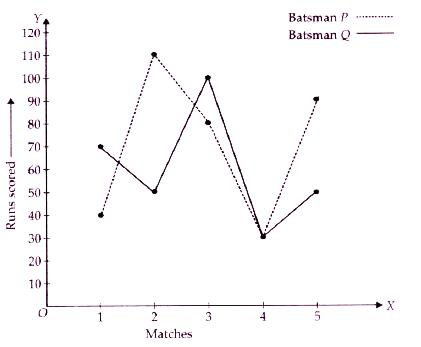
View SolutionPerformance based graph) The given graph shows the total runs scored by two batmans P and Q during each of the five different matches in the year 2011. study the graph and answer the following questions :
What information is given on the axes?
View SolutionRead the bar graph shown in figure and answer the following questions.
What is the information given by the bar graph?
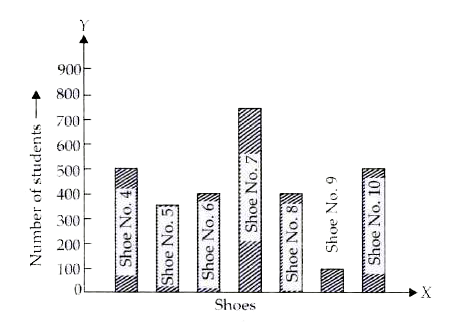
View SolutionRead the following bar graph (Figure) and answer the following questions: What information is given by the bar graph? What was the production of cement in the year 1980-81? What is the minimum and maximum productions of cement and corresponding years?
View Solution

