Pie chart is drawn with the help of
radius of the circle
chords of the circle
sectors of the circle
diameter of the circle
The correct Answer is:C
To determine how a pie chart is drawn, let's break down the steps involved in understanding the components of a pie chart.
1. Understanding the Pie Chart: A pie chart is a circular statistical graphic that is divided into slices to illustrate numerical proportions. Each slice represents a category's contribution to the whole.
2. Identifying Components: The key components of a pie chart are:
- The entire circle represents the total data set.
- Each slice (or sector) represents a part of the data set.
3. Sectors of a Circle: The slices of a pie chart are known as sectors. Each sector's angle is proportional to the quantity it represents. For example, if one category represents 25% of the total, its corresponding sector will take up 25% of the circle's total angle (which is 360 degrees).
4. Conclusion: Therefore, a pie chart is drawn with the help of the sectors of a circle.
Answer:
The pie chart is drawn with the help of sectors of a circle.
- The entire circle represents the total data set.
- Each slice (or sector) represents a part of the data set.
The pie chart is drawn with the help of sectors of a circle.
Topper's Solved these Questions
- STATISTICS BOOK - ARIHANT PUBLICATION JHARKHANDCHAPTER - STATISTICS EXERCISE - Exam Booster for Cracking Exam
25 Videos
- SOLVED PAPER 2019BOOK - ARIHANT PUBLICATION JHARKHANDCHAPTER - SOLVED PAPER 2019EXERCISE - SECTION I: MATHEMATICS
48 Videos
- TAXATION BOOK - ARIHANT PUBLICATION JHARKHANDCHAPTER - TAXATION EXERCISE - EXAM BOOSTER
14 Videos
Similar Questions
Knowledge Check
IF a pie chart is drawn representive the number of students in all five colleges, what is the central angle whole of the sector representing the students of colleges B?
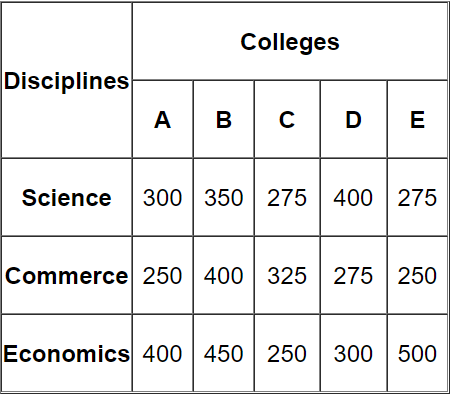 A80∘B82∘C84∘D86.4∘
The pie chart drawn below shows the spendings of a country on various sports during a particular year. Study the pie chart and answer the questions.
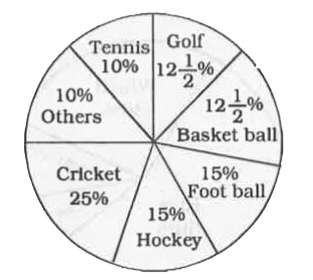
The ratio of the amount spent on football, basketball and cricket to that spent on tennis, hockey and golf isA5:7B7:5C15:1D3:20The pie chart drawn below shows the spendings of a country on various sports during a particular year. Study the pie chart and answer the questions.
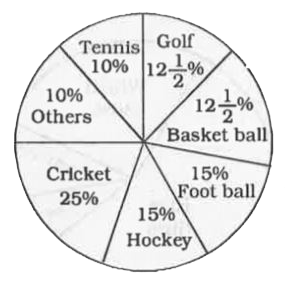
Total central angle showing the money spent on hockey, football and other during the year wasA104∘B244∘C96∘D144∘
The Pie-chart shows the result of a survey among 119060 people concerning the use of tobacco. Study the Pie-chart and answer the questions.
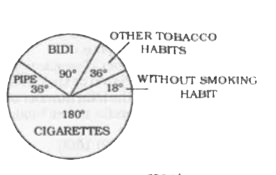
The number of people smoking Cigarettes is :
View SolutionThe Pie-chart shows the result of a survey among 119060 people concerning the use of tobacco. Study the Pie-chart and answer the questions.
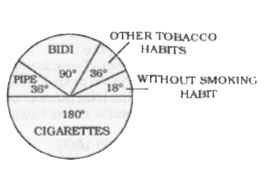
The number of people preferring Bidi is :
View SolutionThe pie chart drawn below shows the spendings of a country on various sports during a particular year. Study the pie chart and answer the questions.
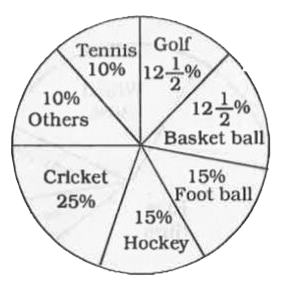
If, the total amount spent on sports during the year was Rs. 1,20,00,000, how much was spent on basketball ?
View SolutionThe pie chart drawn below shows the spendings of a country on various sports during a particular year. Study the pie chart and answer the questions.
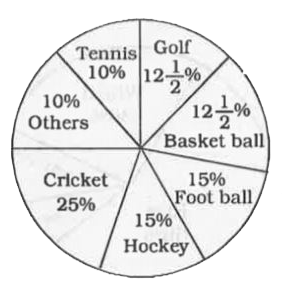
If the money spent on cricket during the year was Rs. 20,00,000, then the money spent on tennis was :
View SolutionPie charts shows the expenses on various heads in construction of a house. Study the pie-chart.
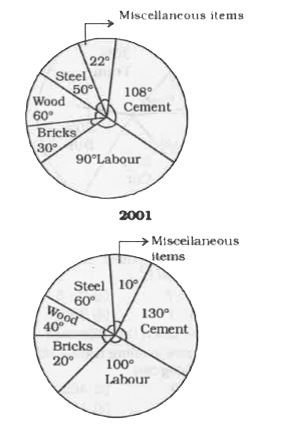
What percentage of the total amount is being spent on cement in 1991 ?
View Solution

