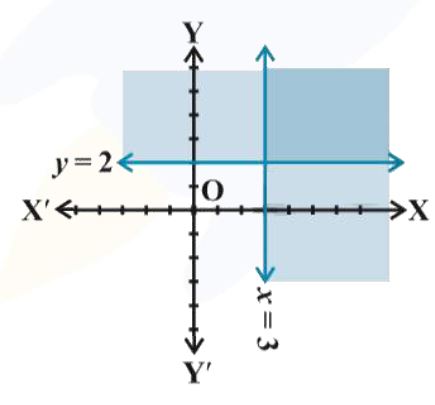
Solve the system of inequalities graphically : x≥3,y≥2
Video Solution
Text Solution
x≥3,y≥2
The graph of the lines, x=3 and y=2 are drawn in the figure below.
Inequality x≥3 represents the region on the right-hand side of the line, x=3 (including the line x=3), and inequality represents the region above the line, y=2 (including the line y=2).
Hence, the solution of the given system of linear inequalities is represented by the common shaded region including the points on the respective lines as follow:

|
Topper's Solved these Questions
- LINEAR INEQUALITIESBOOK - NCERTCHAPTER - LINEAR INEQUALITIESEXERCISE - SOLVED EXAMPLES
20 Videos
- LINEAR INEQUALITIESBOOK - NCERTCHAPTER - LINEAR INEQUALITIESEXERCISE - EXERCISE 6.2
10 Videos
- LINEAR INEQUALITIESBOOK - NCERTCHAPTER - LINEAR INEQUALITIESEXERCISE - EXERCISE 6.1
26 Videos
- LIMITS AND DERIVATIVESBOOK - NCERTCHAPTER - LIMITS AND DERIVATIVESEXERCISE - EXERCISE 13.3
8 Videos
- MATHEMATICAL REASONINGBOOK - NCERTCHAPTER - MATHEMATICAL REASONINGEXERCISE - EXERCISE 14.3
4 Videos
Similar Questions
Solve the system of inequalities graphically : x≥3,y≥2
View SolutionSolve the system of inequalities graphically :x+y≤6,x+y≥4
View SolutionSolve the system of inequalities graphically :3x+2y≤150,x+4y≤80,x≤15,y≥0.
View SolutionSolve the system of inequations graphically: x≥1,y≤4
View SolutionSolve the system of inequalities graphically :3x+2y≤12,x≥1,y≥2
View SolutionSolve the system of inequalities graphically :5x+4y≤20,x≥1,y≥2
View SolutionSolve the system of inequalities graphically :x+y>4,2x−y>0
View SolutionSolve the system of inequalities graphically :4x+3y≤60,y≥2x,x≥3,x,y≥0.
View SolutionSolve the system of inequalities graphically :3x+4y≤60,x+3y≤30,x≥0,y≥0.
View SolutionSolve the system of inequations graphically: x+2y≤3,3x+4y≥12,x≥0,y≥1
View Solution
