Study the graph carefully and answer the following questions.
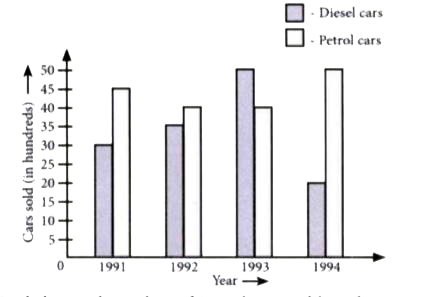
Find the total number of Diesel cars sold in the year 1992 and 1994 together.
2500
5500
1500
4500
The correct Answer is:B
Step by step video, text & image solution for Study the graph carefully and answer the following questions. Find the total number of Diesel cars sold in the year 1992 and 1994 together. by Maths experts to help you in doubts & scoring excellent marks in Class 7 exams.
Updated on:21/07/2023Topper's Solved these Questions
- PREP TEST 2 Book:MTG IIT JEE FOUNDATIONChapter:PREP TEST 2 Exercise:SECTION-B
Explore 30 Videos
- PREP TEST 1 Book:MTG IIT JEE FOUNDATIONChapter:PREP TEST 1 Exercise:SECTION-B
Explore 29 Videos
- RATIONAL NUMBERS Book:MTG IIT JEE FOUNDATIONChapter:RATIONAL NUMBERS Exercise:OLYMPIAD/HOTS CORNER
Explore 20 Videos
Similar Questions
Directions: The following bar graph shows the number of pages in five different books (viz. A, B, C, D and E). Study the graph carefully and answer the following questions.
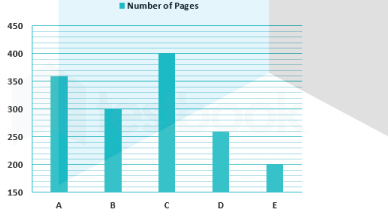
What is the ratio of total number of pages in book B and E together to the total number of pages in book C and D together?
View SolutionStudy the given graph carefully and answer the following questions.
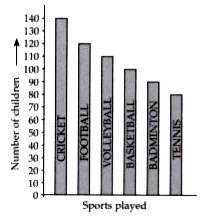
What fraction of the total number of children plays football ?
View Solution
Knowledge Check
Study the graph carefully and answer the following questions.
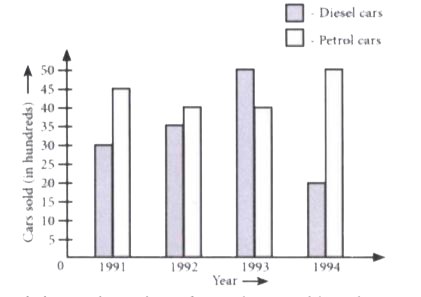
Find the mean sale of Petrol cars.A4735B5745C5740D4375Study the graph carefully and answer the following questions.
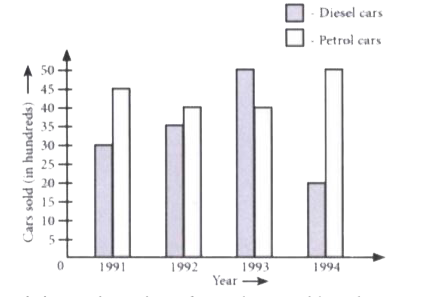
How many more Diesel cars were sold in 1991 than in 1994?A500B1500C1000D2000Study the graph carefully and answer the following questions.
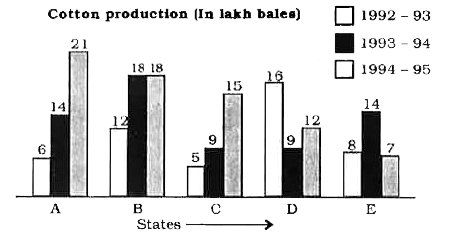
Which of the following statement is false ?AState A and E showed the same production in 1993-94.BThere was no improvement in the production of cotton in state B during 1994-95.CState A has produced maximum cotton during the given period.DProduction of state C and D together is equal to that of state B dring 1993-94.
Bar graph given below shows pens sold by a retailor on five different days. Study the data carefully and answer the following questions.
Pen sold on different days
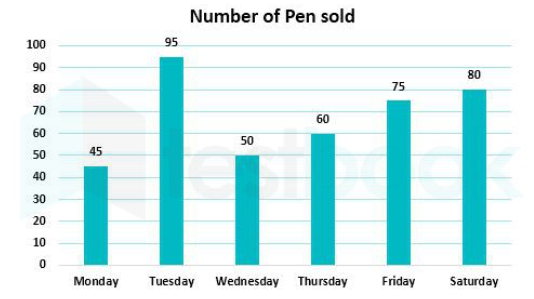
what is the average number of pens sold during a week if total number of pens sold on saturday is 25% more than total number of pens sold on Sunday .
View SolutionBar graph given below shows pens sold by a retailor on five different days. Study the data carefully and answer the following questions.
Pen sold on different days
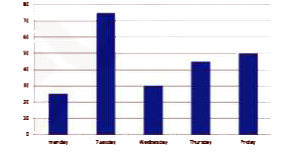
Total number of pens sold on Saturday is 40% more than total number of pens sold on Wednesday. Find total number of pens sold on Friday and Saturday together?
View SolutionStudy the graph carefully and answer the following questions.
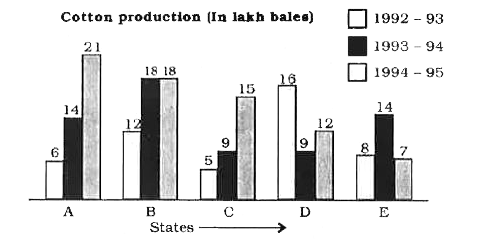
What is the average production of the four states in the year 1994-95 taken together ?
View SolutionStudy the graph carefully and answer the following questions.
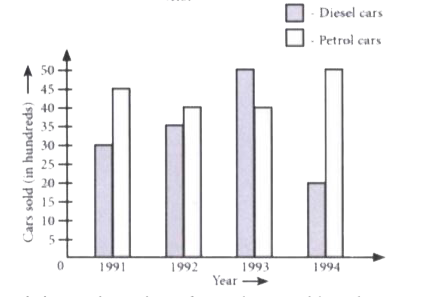
How many cars were sold during the year 1991?
View SolutionStudy the table carefully to answer the following questions ----
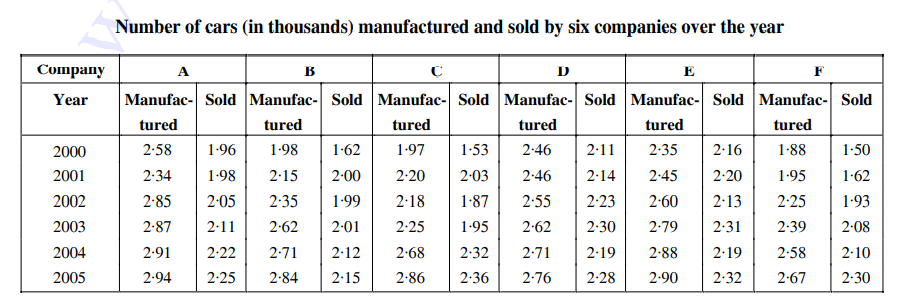
What is the percentage of number of cars sold by company D in the year 2002 to those manufactured by it in that year ? (rounded off to two digits after decimal)
View Solution
