Table-I and Table-II shows the number of Government employees in some cities. Study the table and answer the following questions
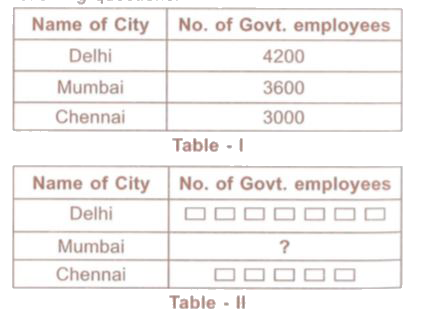
How many employees does each □ represent ?
500
600
700
800
The correct Answer is:B
Step by step video & image solution for Table-I and Table-II shows the number of Government employees in some cities. Study the table and answer the following questions How many employees does each square represent ? by Maths experts to help you in doubts & scoring excellent marks in Class 6 exams.
Topper's Solved these Questions
- BOOK - SCIENCE OLYMPIAD FOUNDATION CHAPTER - DATA HANDLINGEXERCISE - Achievers section (Hots)5videos
DATA HANDLING
- BOOK - SCIENCE OLYMPIAD FOUNDATION CHAPTER - CLASS 6 SAMPLE PAPER FINAL 4EXERCISE - Section A- Mathematics10videos
CLASS 6 SAMPLE PAPER FINAL 4
- BOOK - SCIENCE OLYMPIAD FOUNDATION CHAPTER - DECIMALS EXERCISE - Achievers Section (Hots)5videos
DECIMALS
Similar Questions
Direction: The following table shows the data of people of five different cities. Study the following table and answer the following questions.
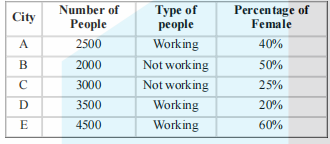
The total number of males who are working out of five cities is-View SolutionThe line graph shows the Sales per employee of a certain company. Study the diagram and answer the following questions.
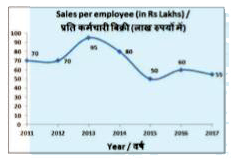
If the number of employees of the company was 80 in the year 2015 then what was the sales (in Rs crore) of the company in the year 2015?View Solution
Knowledge Check
- Question 1 - Select One
The bar graph shows the number of employees working in the different departments of a company. Study the diagram and answer the following questions.
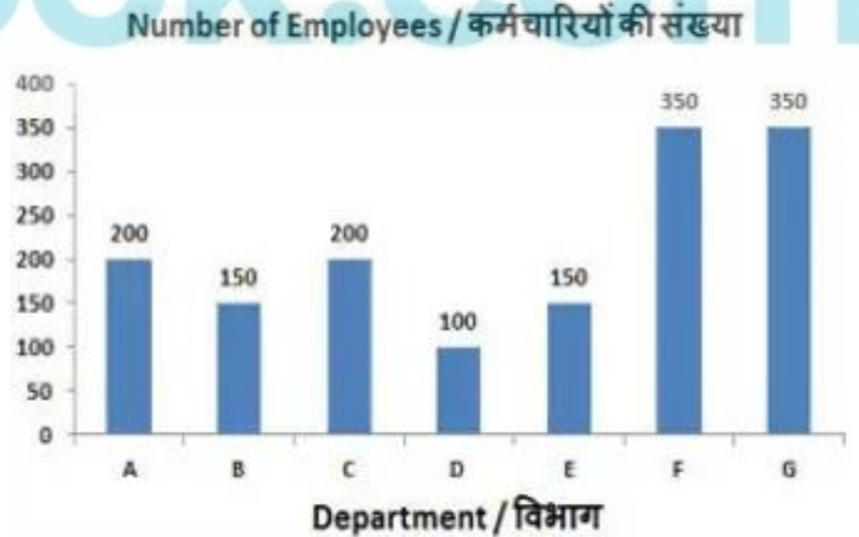
The number of employees of department G are greater than those of department C by ________.Aa. 42.8%Bb. 75%Cc. 150%Dd. 84.2% - Question 2 - Select One
The HR department of An MNC prepared a report. The pie chart from the report shows number of employees the MNC has in different countries. Study the diagram and answer the following questions.
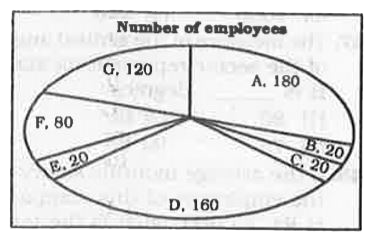
The most number of employees are from which country?AFBCCDDA - Question 3 - Select One
The HR department of An MNC prepared a report. The pie chart from the report shows number of employees the MNC has in different countries. Study the diagram and answer the following questions.
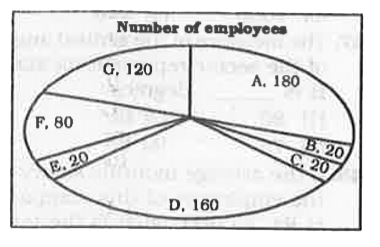
What is the total number of employees of the MNC?A400B600C500D300
Pie chart given below shows total number of workers in three different companies. Table given below shows ratio between officers and workers working in these companies. Study the data carefully and answer the following questions . total workers = 900
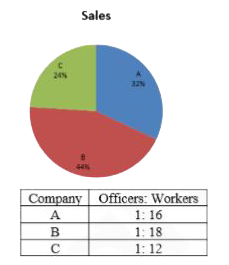
Note: total employees = officers + workers
Total number of employees in company ‘B’ is how much more than total number of employees in company ‘C’.View SolutionThe HR department of a company prepared a report. The pie chart from the report shows number of employees in all the departments that thew company has. Study the diagram and answer the following questions.
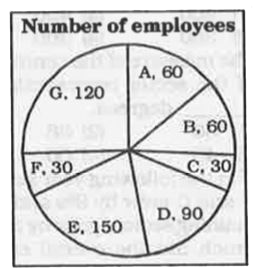
What is the total number of employees of the company?View SolutionThe HR department of a company prepared a report. The pie chart from the report shows number of employees in all the departments that thew company has. Study the diagram and answer the following questions.
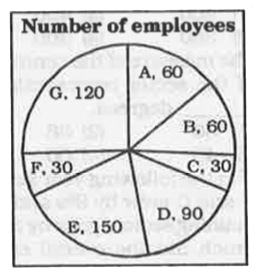
The most number of employees belong to which department?View SolutionThe bar graph shows the number of employees working in the different departments of a company. Study the diagram and answer the following questions
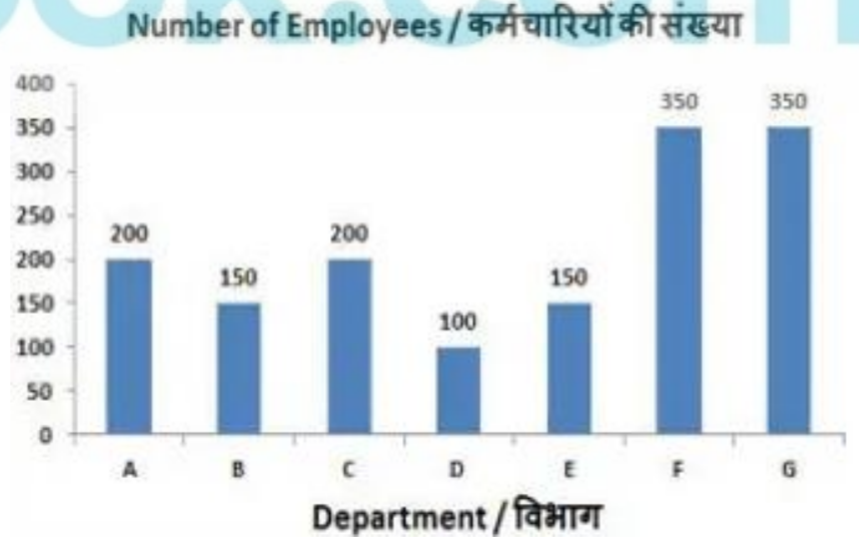
Which department has the lowest number of employees?View SolutionThe bar graph shows the number of employees working in the different departments of a company. Study the diagram and answer the following questions.
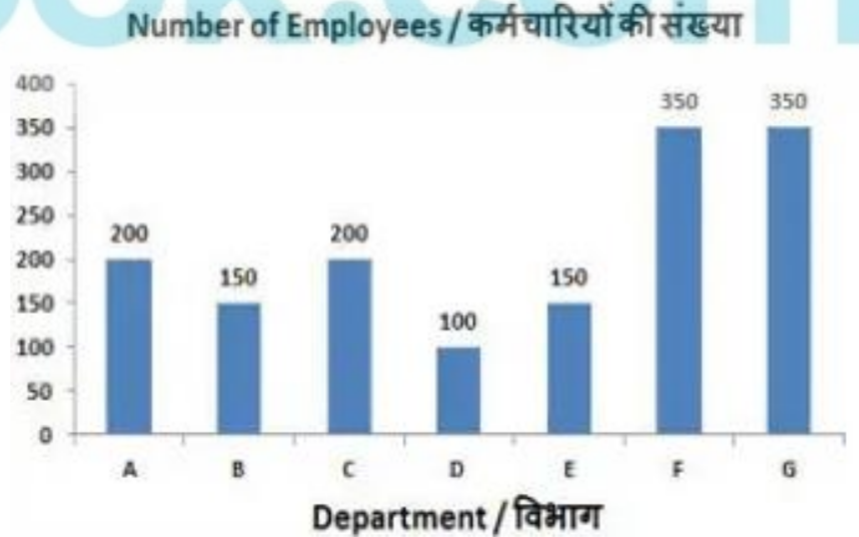
What is the ratio of number of employees of department A to that of department F?View Solution

