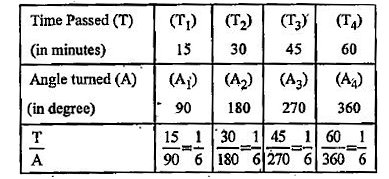
Take a clock and fix its minute hand at 12.
Record the angle turned through by the minute hand from its original position and the time that has passed, in the following table :

What do you observe about T and A ? Do they increase together ? Solution in Punjabi
Step by step video & image solution for Take a clock and fix its minute hand at 12. Record the angle turned through by the minute hand from its original position and the time that has passed, in the following table : What do you observe about T and A ? Do they increase together ? by Maths experts to help you in doubts & scoring excellent marks in Class 8 exams.
Topper's Solved these Questions
- BOOK - SWAN PUBLICATIONCHAPTER - DIRECT AND INVERSE PROPORTIONS EXERCISE - Try These5videos
DIRECT AND INVERSE PROPORTIONS
- BOOK - SWAN PUBLICATIONCHAPTER - DIRECT AND INVERSE PROPORTIONS EXERCISE - Think, Discuss And Write2videos
DIRECT AND INVERSE PROPORTIONS
- BOOK - SWAN PUBLICATIONCHAPTER - DATA HANDLINGEXERCISE - Exercise 5.313videos
DATA HANDLING
- BOOK - SWAN PUBLICATIONCHAPTER - EXPONENTS AND POWERS EXERCISE - Exercise 12.217videos
EXPONENTS AND POWERS
Similar Questions
Observe the following tables and find if x and y are directly proportional:
 .01:37View Solution
For a fixed time period and rate of interest simple interest is directly proportional to the principal.
06:07View SolutionList the outcomes you can see in these experiments: Spinning a wheel
 02:11View Solution
Express the following numbers in standard form : 0.0000000000085
01:31View SolutionHow many lines of symmetry does the above figure have ?
02:45View SolutionWhich of the following are correct chain isomers of butane ? (i)
02:17View SolutionDetermine the point of symmetry of a regular hexagon.
05:41View SolutionDtermine the images of the following figure about the given line :
02:10View SolutionMatch the following Column A to Column B
 02:17View Solution
Match the following Column A to Column B
 02:10View Solution
Match the following Column A to Column B
 04:23View Solution
The inequation represented by the graph given below is :
01:21View SolutionThe inequation that best describes the graph given below is _________
02:41View SolutionThe inequation that best describes the following graph is _________
02:41View SolutionWhich inequations represent the shaded region in the given figure
02:41View SolutionWrite the vector →F in terms of its component :-
ltimg src="https://d10lpgp6xz60nq.cloudfront.net/physics_images/ALN_PHY_R02_E02_002_Q01.png" width="80%"gt01:54View Solution

