The annual profits earned by 30 shops of a shopping complex in a locality are recorded in the table shown below
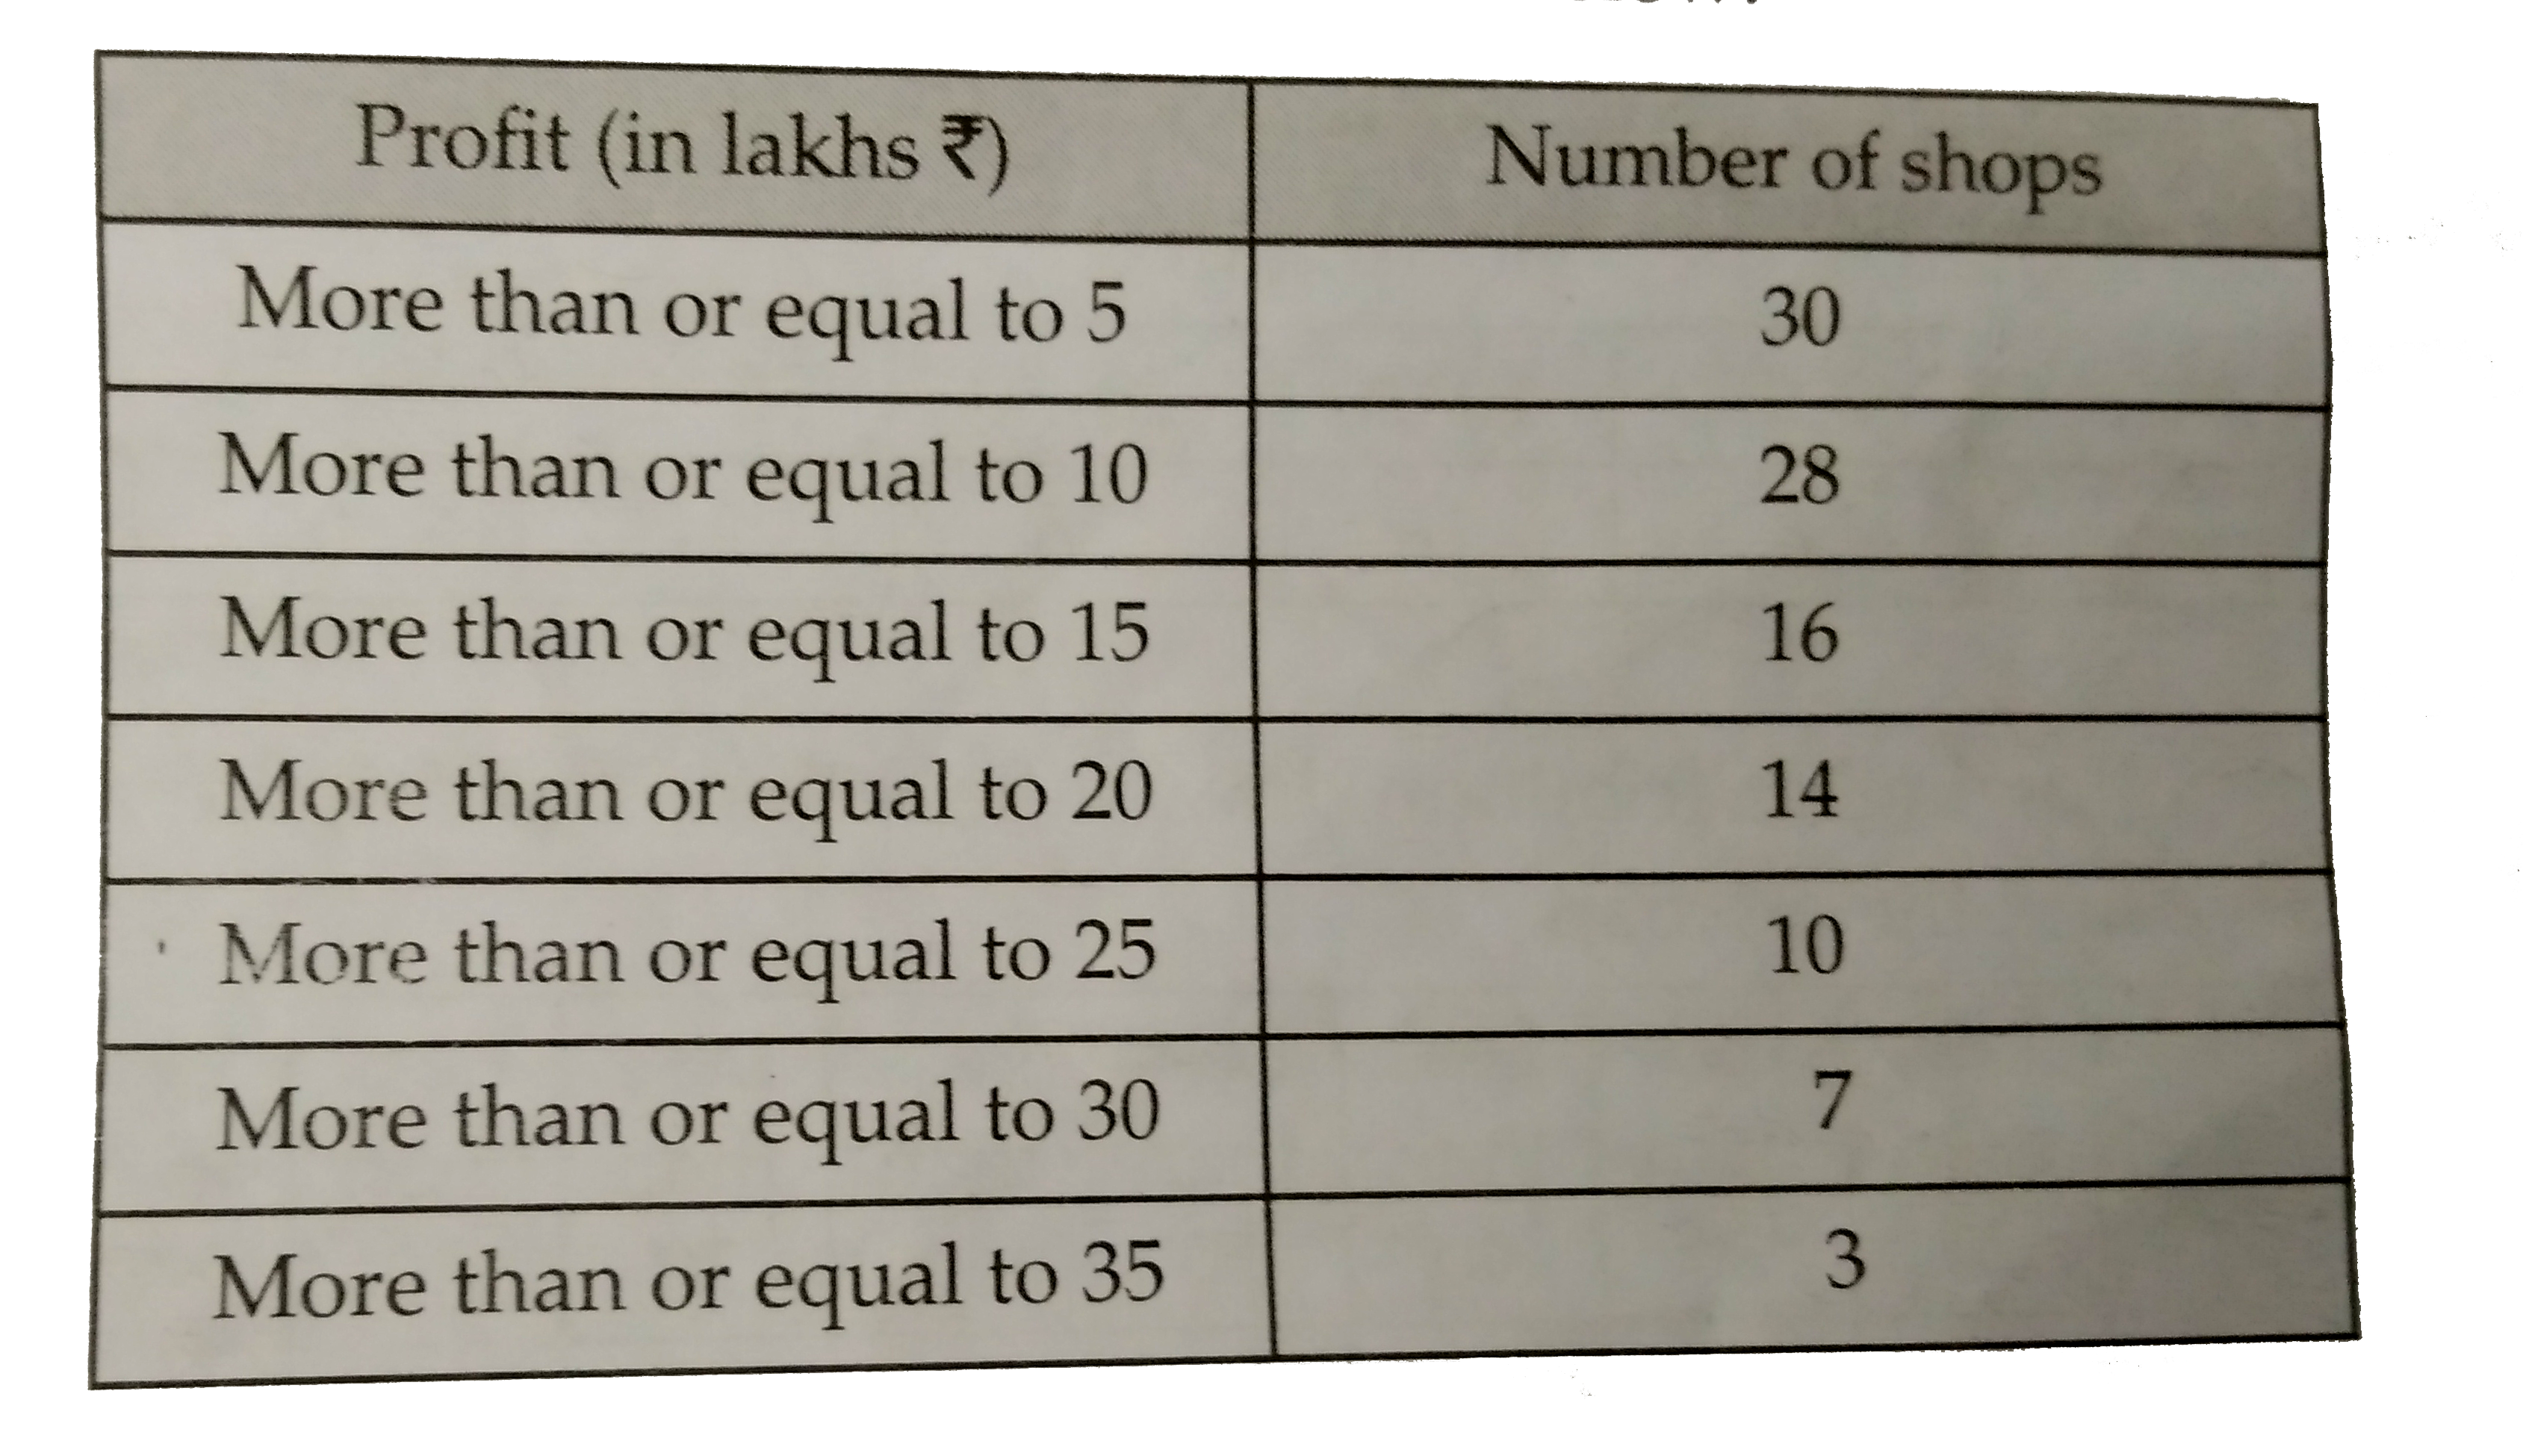
If we draw the frequency distribution table for the above data, find the frequency corresponding to the class 20- 25.
The correct Answer is:4
Step by step video & image solution for The annual profits earned by 30 shops of a shopping complex in a locality are recorded in the table shown below If we draw the frequency distribution table for the above data, find the frequency corresponding to the class 20- 25. by Maths experts to help you in doubts & scoring excellent marks in Class 10 exams.
Similar Questions
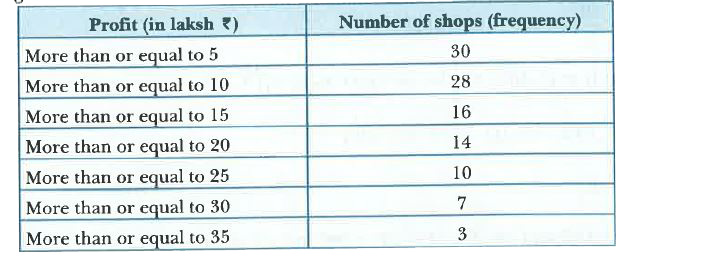
The annual profits earned by 30 shops of a shopping complex in a locality give rise, to the following distribution.
 View Solution
The annual profits earned by 30 shops of a shopping complex in a locality give rise to the following distribution:Draw both ogives for the data above. Hence obtain the median profit.
View Solution
Knowledge Check
- Question 1 - Select One
The class marks of a frequency distribution are 15, 20, 25, 30. The class corresponding to the class mark 20 is
A12.5-17.5B17.5-22.5C18.5-21.5D19.5 -20.5 - Question 2 - Select One
The class marks of a frequency distribution are 15, 20, 25, 30, ..... The class corresponding to the class mark 25 is
A12.5-17.5B20.5-29.5C18.5-21.5D22.5-27.5 - Question 3 - Select One
The class marks of a frequency distribution are given as follows 15,20, 25,……….. The class corresponding to the class mark 20 is
A12.5−17.5B16.5−21.5C17.5−22.5D19.5−20.5
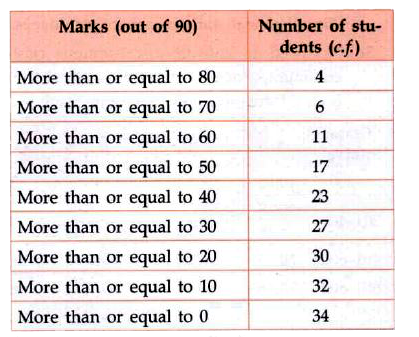
Form the frequency distribution table from the following data:
Construct the frequency distribution table for the above data.
 View Solution
The annual profits earned by 30 shops of a shopping complex in a locality give rise to the following distribution: Profit (in lakhs in Rs) Number of shops (frequency) More than or equal to 5 30 More than or equal to 10 28 More than or equal to 15 16 More than or equal to 20 14 More than or equal to 25 10 More than or equal to 30 7 More than or equal to 35 3 Draw both ogives for the above data and hence obtain the median.
View SolutionGiven below is a frequency distribution table. Read it and answer the questions that follow:
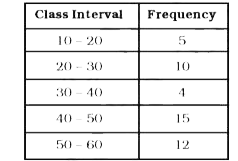
What is the frequency of the third class?View SolutionThe weights of 20 students in a class are given below.
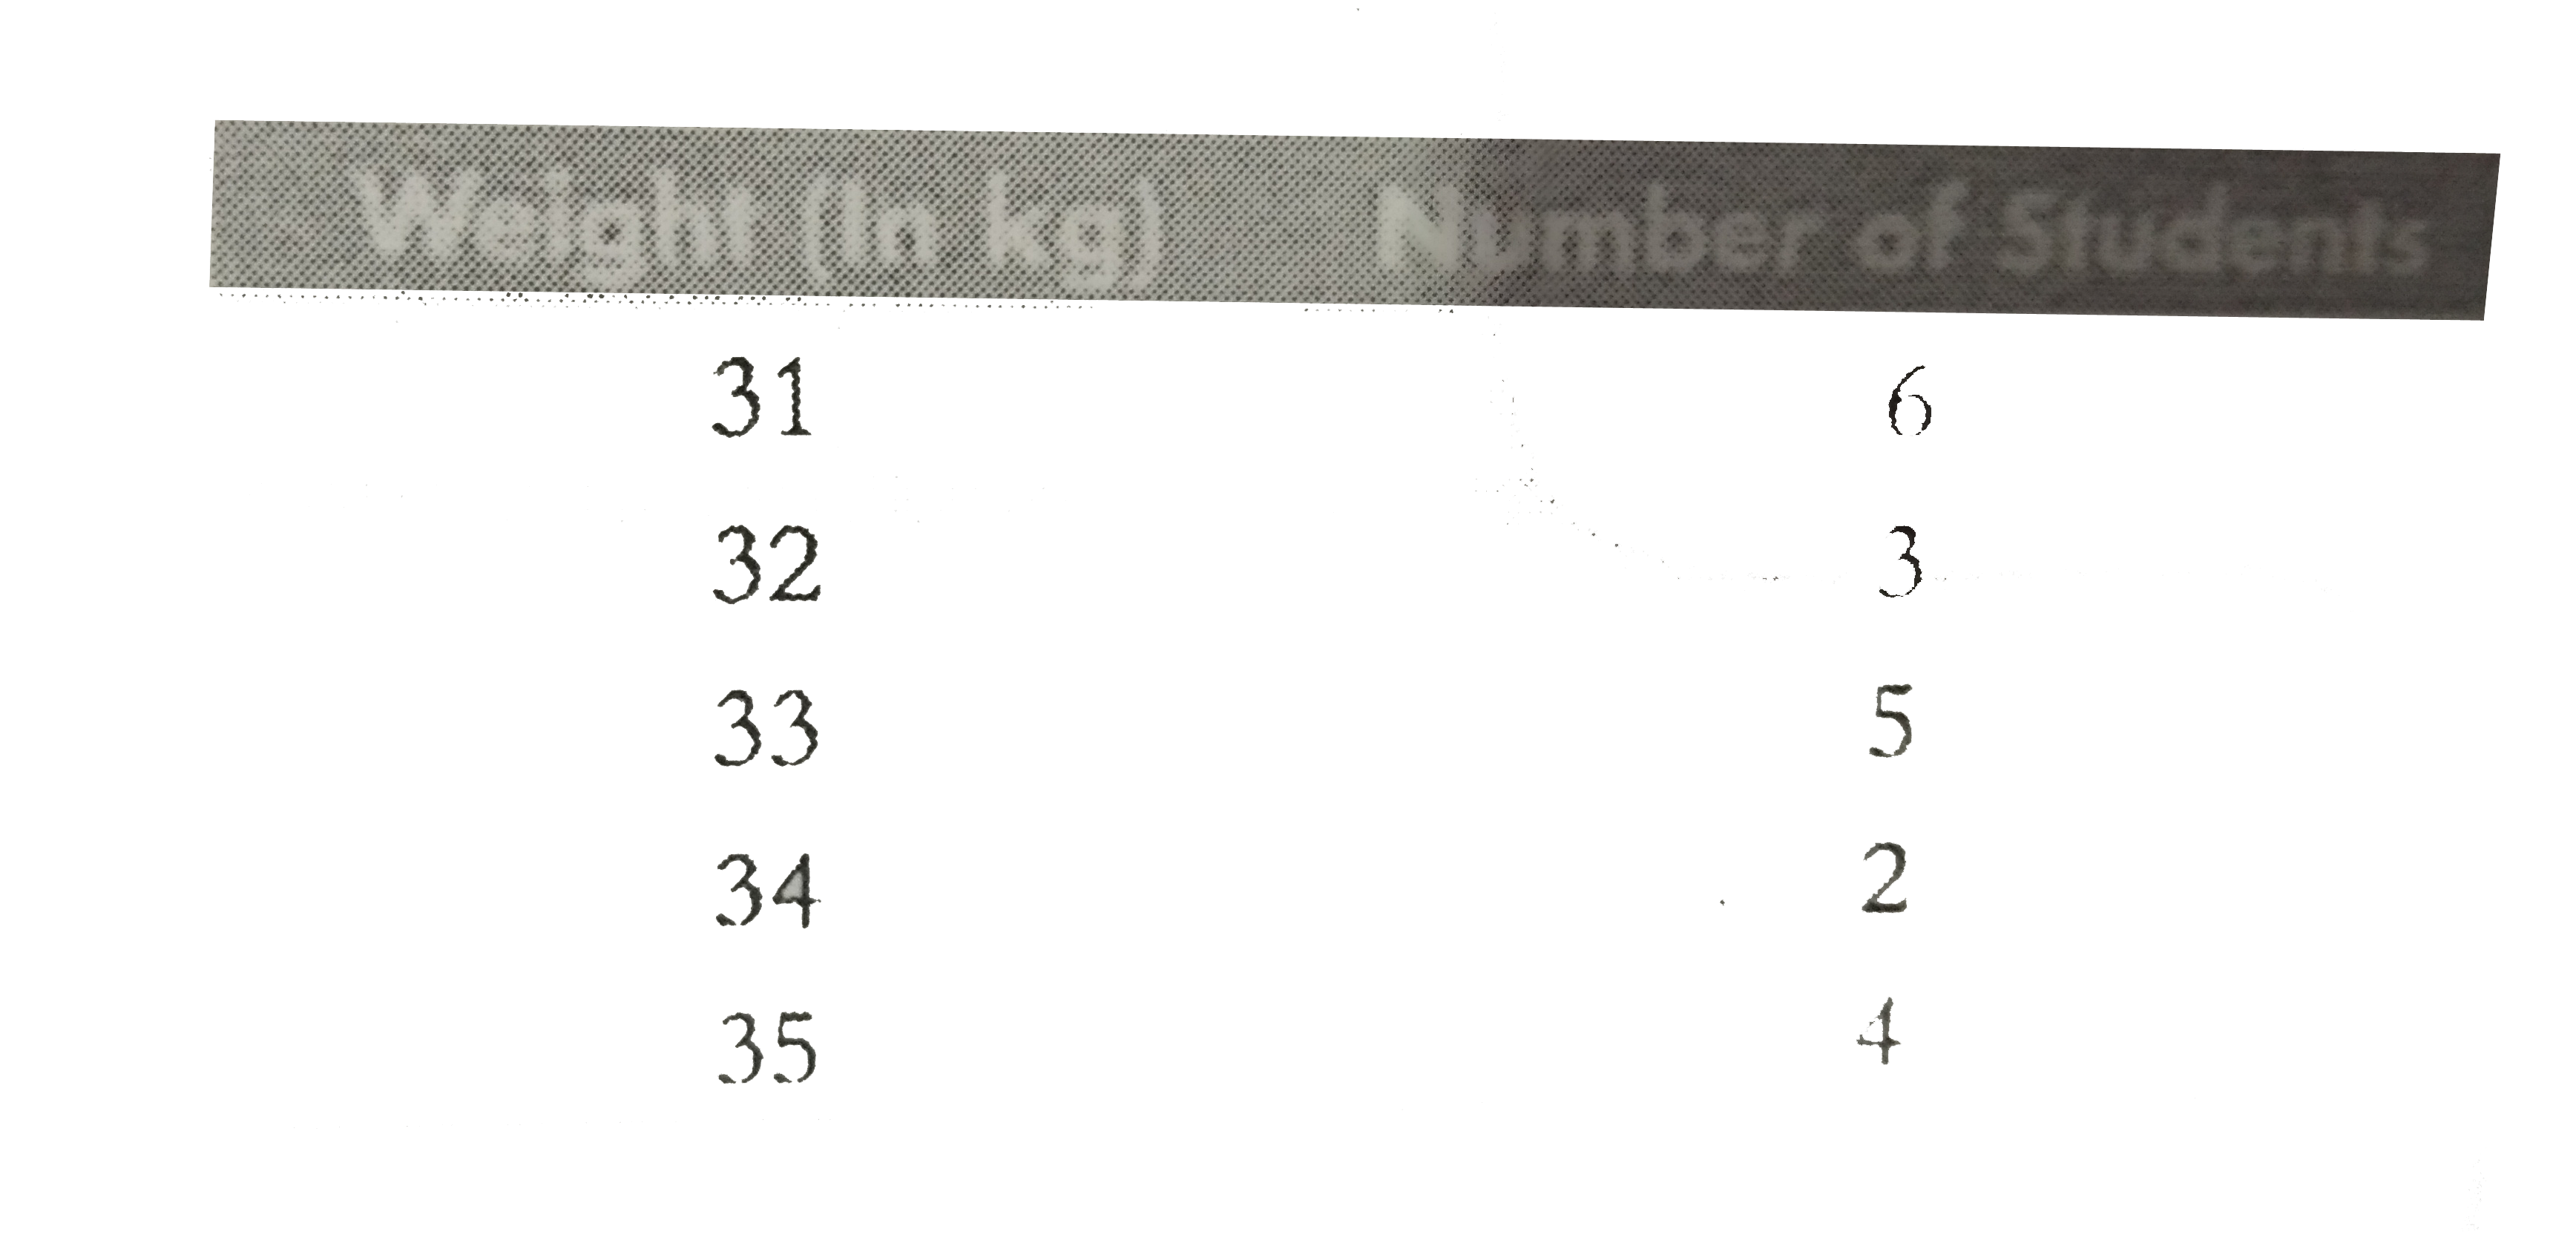
Find the median of the above frequency distribution .View SolutionGiven below is a frequency distribution table. Read it and answer the questions that follow:
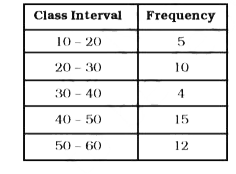
What is the class size?View Solution

