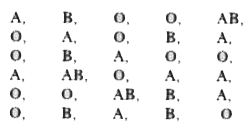
The blood groups of 30 students of class VIII are recorded as follows

represent this data in the form of frequency distribution table. Find our which is the most common and which is the rerest blood group among these students.Solution in Kannada
Step by step video & image solution for The blood groups of 30 students of class VIII are recorded as follows represent this data in the form of frequency distribution table. Find our which is the most common and which is the rerest blood group among these students. by Maths experts to help you in doubts & scoring excellent marks in Class 9 exams.
Updated on:21/07/2023Topper's Solved these Questions
Similar Questions
Use suitable identities to find the following products:
(i) (x+4)(x+10)
(ii) (x+8) (x-10)
(iii) (3x+4) (3x -5)
(iv) (y2+32)(y2−32)
(v) (3−2x)(3+2x)
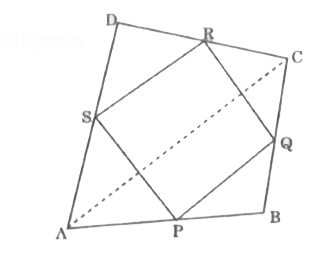
View SolutionABCD is a quadrilateral in which P,Q,R and S are mid points of the sides AB,BC,CD and DA. AC is a diagonal Show that:
SR∣∣ACandSR=12AC
PQ=SR
PQRS is a parallelogram

View Solution
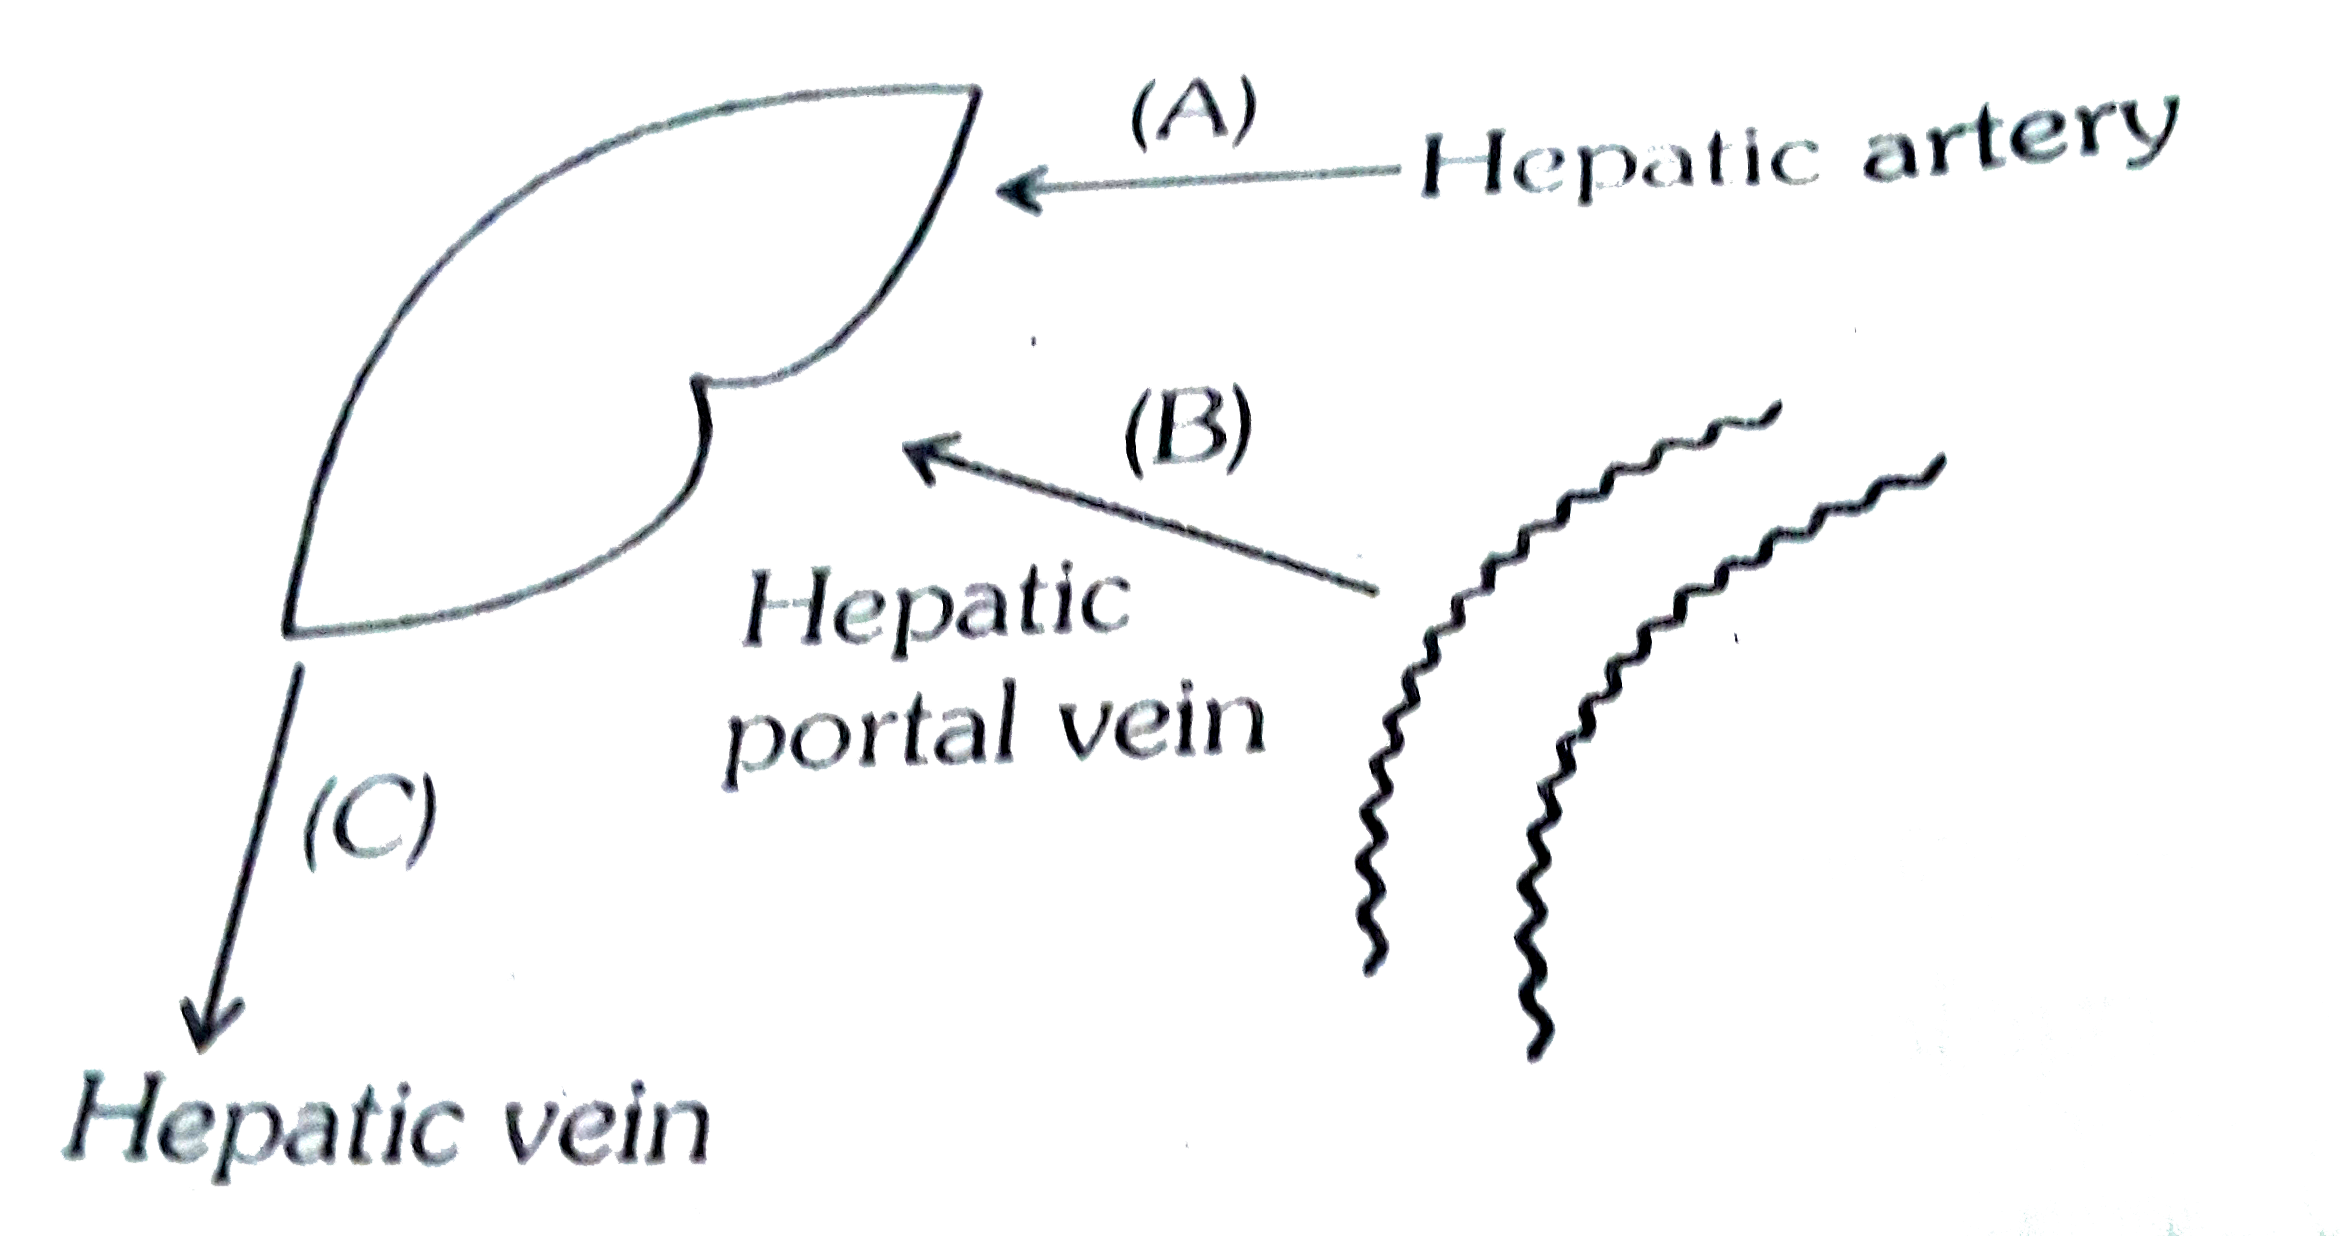
In which of the above given blood vessels maximum urea is present.
View SolutionWhich of the following are correct chain isomers of butane ? (i)
View SolutionDetermine the point of symmetry of a regular hexagon.
View SolutionDtermine the images of the following figure about the given line :
View SolutionMatch the following Column A to Column B

View SolutionMatch the following Column A to Column B

View SolutionMatch the following Column A to Column B

View SolutionThe inequation represented by the graph given below is :
View SolutionThe inequation that best describes the graph given below is _________
View SolutionThe inequation that best describes the following graph is _________
View SolutionWhich inequations represent the shaded region in the given figure
View SolutionThe blood group of 36 students of IX class are recorded as follows

Represent the data in the form of frequency distribution table. Which is the most common and which is the rarest blood group among these students?
View SolutionThe blood group of 36 students of IX class are recorded as follows

Represent the data in the form of frequency distribution table. Which is the most common and which is the rarest blood group among these students?
View Solution
