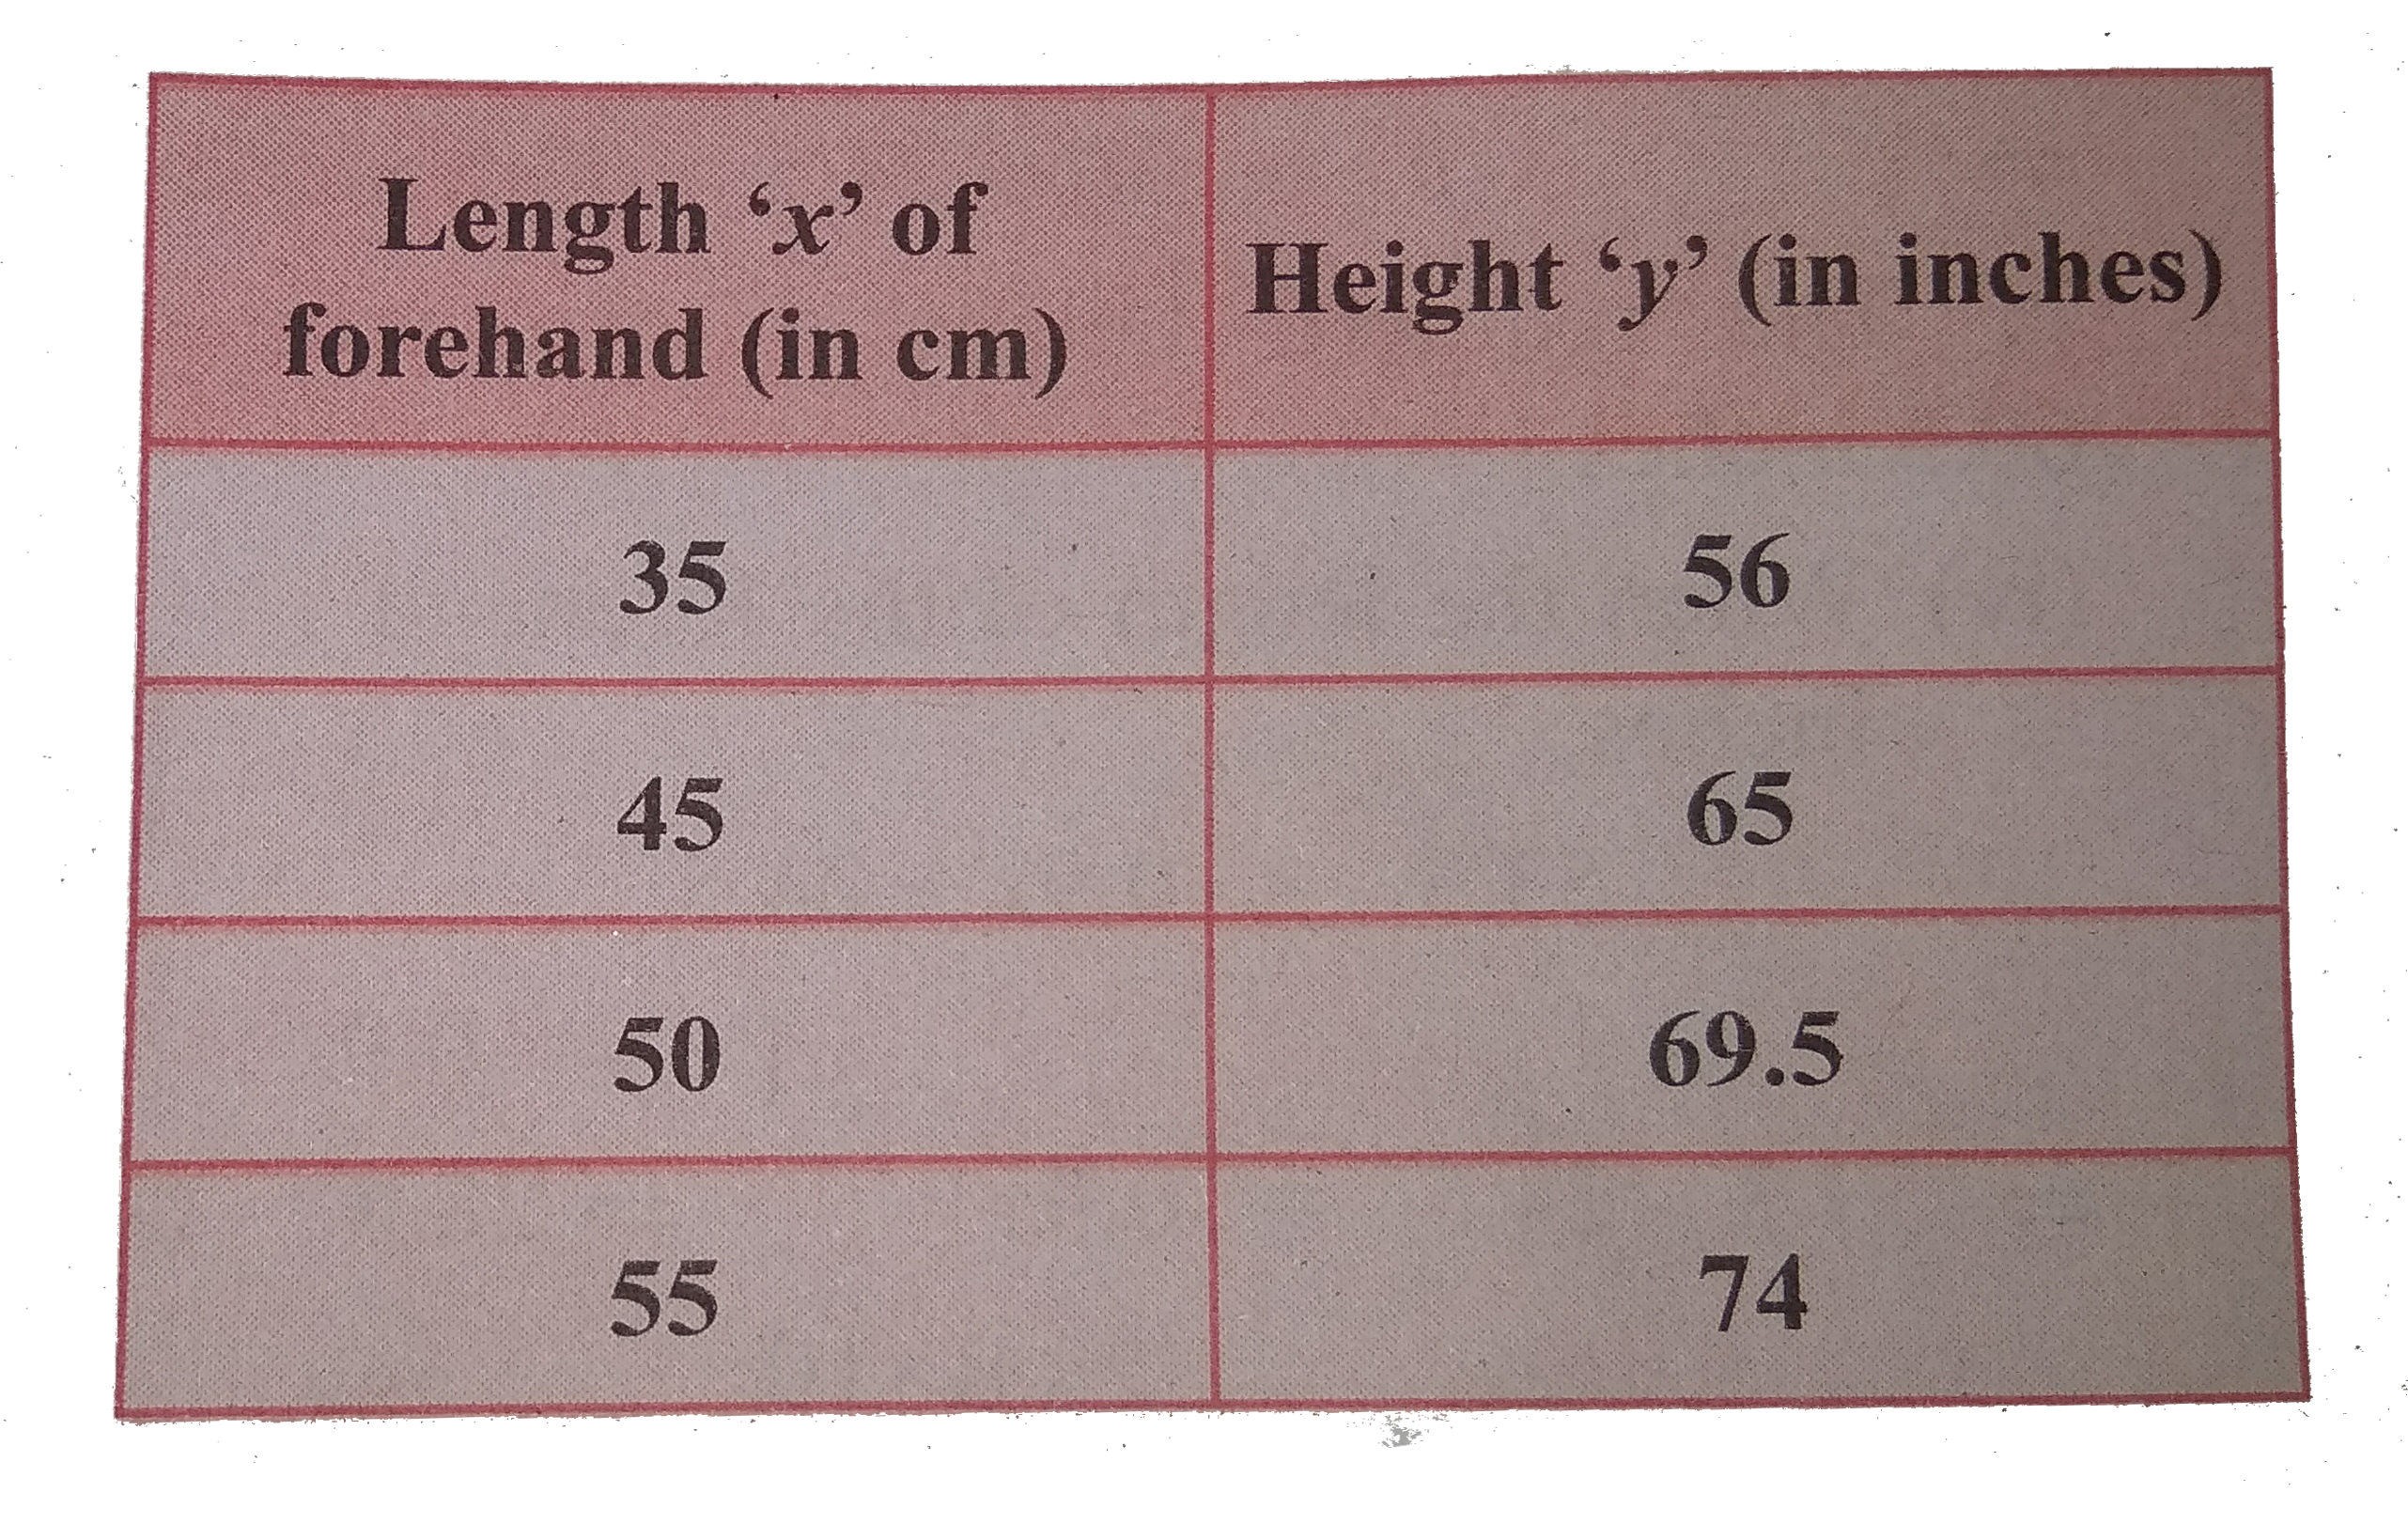
The data in the adjcent table depicts the length of a woman's foreheads and her corresponding height. Based on this data, a student finds a relationship between the height (y) and the forehead length (x) as , where a, b are constants.

Check if this relation is a functions.Solution in Tamil
The correct Answer is:32 cm
Step by step video, text & image solution for The data in the adjcent table depicts the length of a woman's foreheads and her corresponding height. Based on this data, a student finds a relationship between the height (y) and the forehead length (x) as y=ax+b, where a, b are constants. Check if this relation is a functions. by Maths experts to help you in doubts & scoring excellent marks in Class 10 exams.
Updated on:21/07/2023Topper's Solved these Questions
- RELATIONS AND FUNCTIONS BOOK - FULL MARKSCHAPTER - RELATIONS AND FUNCTIONS EXERCISE - EXERCISE 1.4
12 Videos
- RELATIONS AND FUNCTIONS BOOK - FULL MARKSCHAPTER - RELATIONS AND FUNCTIONS EXERCISE - EXERCISE 1.5
10 Videos
- RELATIONS AND FUNCTIONS BOOK - FULL MARKSCHAPTER - RELATIONS AND FUNCTIONS EXERCISE - EXERCISE 1.2
5 Videos
- NUMBERS AND SEQUENCESBOOK - FULL MARKSCHAPTER - NUMBERS AND SEQUENCESEXERCISE - ADDITIONAL QUESTION SOLVED (III. ANSWER THE FOLLOWING).
12 Videos
- SAMPLE PAPER - 10 (UNSOLVED)BOOK - FULL MARKSCHAPTER - SAMPLE PAPER - 10 (UNSOLVED)EXERCISE - PART - IV
2 Videos
Similar Questions
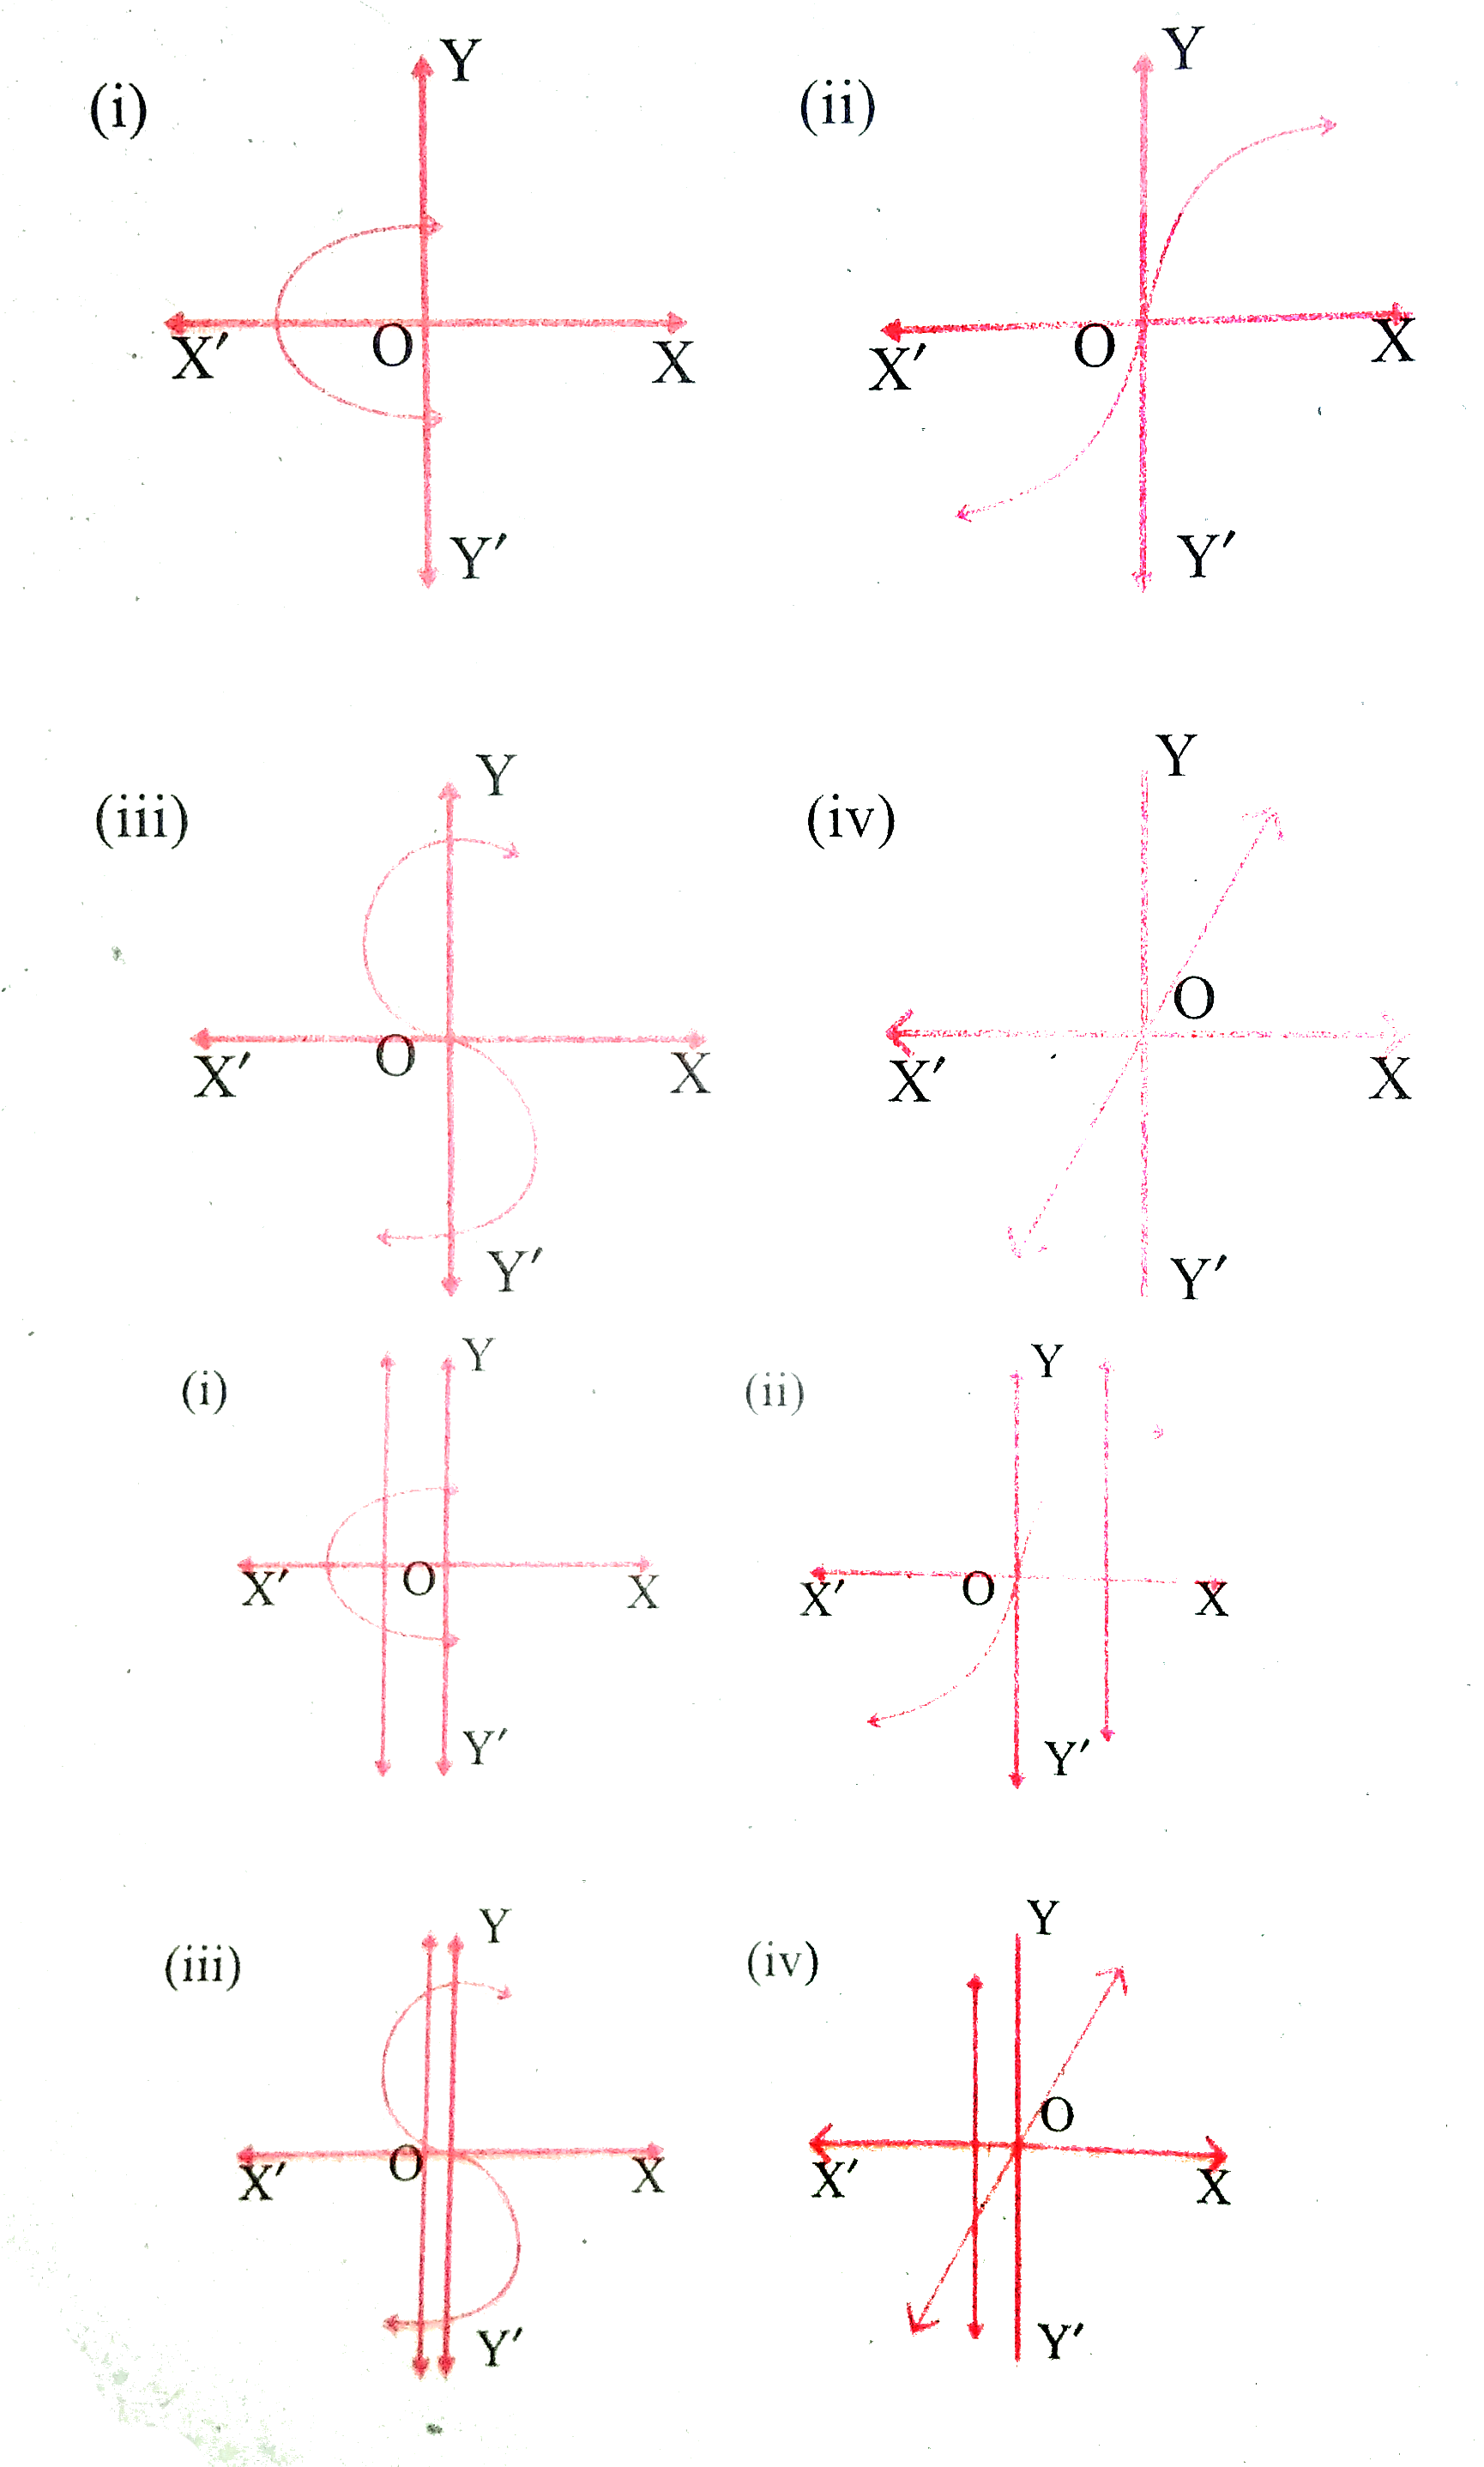
Determine whether the graph given below represents functions. Give reason for your answers concering each graph

View SolutionUsing the function f and g given below, find the fog and gof. Check whether fog=gof.
f(x)=x−6,g(x)=x3
View SolutionLet A={1,2,3,7}andB={3,0,−1,7}, which of the following are relation from A to B?
R1={(2,1),(7,1)}
View SolutionUse Euclid's division algorithim to find the HCF of 867 and 255.
View SolutionConstruct a ΔPQR such that QR= 6.5 cm, ∠P=60∘ and the altitude from P to QR is of length 4.5 cm.
View SolutionDetermine the point of symmetry of a regular hexagon.
View SolutionDtermine the images of the following figure about the given line :
View SolutionMatch the following Column A to Column B

View SolutionMatch the following Column A to Column B

View SolutionMatch the following Column A to Column B

View SolutionThe inequation represented by the graph given below is :
View SolutionThe inequation that best describes the graph given below is _________
View SolutionThe inequation that best describes the following graph is _________
View SolutionIn Fig, find the value of x.
ltimg src="https://d10lpgp6xz60nq.cloudfront.net/physics_images/PS_MATH_IX_C12_S01_032_Q01.png" width="80%"gt
View SolutionIf y-x=180^(@) then find the values of x and y. ltimg src="https://d10lpgp6xz60nq.cloudfront.net/physics_images/ALN_PHY_R05_E01_034_Q01.png" width="80%"gt
View SolutionIn the chemical reactions,
ltimg src="https://d10lpgp6xz60nq.cloudfront.net/physics_images/JM_10_CHE_P1_E01_009_S01.png" width="80%"gt
the compounds 'A' and 'B' respectively are
View Solution
