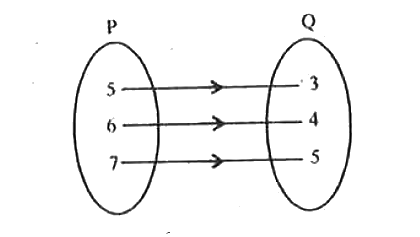
The figure shows a relationship between the sets P and Q. Write relation in (i) Set builder form, (ii) roster form.  Solution in Kannada
Step by step video & image solution for The figure shows a relationship between the sets P and Q. Write relation in (i) Set builder form, (ii) roster form. by Maths experts to help you in doubts & scoring excellent marks in Class 11 exams.
Updated on:21/07/2023Topper's Solved these Questions
- SUPER MODEL QUESTION PAPER-3Book:SUBHASH PUBLICATIONChapter:SUPER MODEL QUESTION PAPER-3Exercise:Point C
Explore 10 Videos
- SUPER MODEL QUESTION PAPER-3Book:SUBHASH PUBLICATIONChapter:SUPER MODEL QUESTION PAPER-3Exercise:Point D
Explore 13 Videos
- SUPER MODEL QUESTION PAPER-3Book:SUBHASH PUBLICATIONChapter:SUPER MODEL QUESTION PAPER-3Exercise:Point E
Explore 4 Videos
- SUPER MODEL QUESTION PAPER-2Book:SUBHASH PUBLICATIONChapter:SUPER MODEL QUESTION PAPER-2Exercise:Point E
Explore 3 Videos
- TRIGONOMETRYBook:SUBHASH PUBLICATIONChapter:TRIGONOMETRYExercise:Prove the following
Explore 201 Videos
Similar Questions
In a survey of 600 students in a school, 150 students were found to be taking tea and 225 taking coffee, 100 were taking both tea and coffee. Find how many students were taking neither tea nor coffee ?
View SolutionFind the equation of the hyperbola whose foci are (0,±12) and the length of the lectus rectum is 36 units.
View SolutionIn how many ways, 4 cards can be chosen from a pack of 52 cards? In how many of these (i) 4 cards are of same suit (ii) two are red cards and twice are black cards. (iii) 4 cards belong to 4 different suits.
View SolutionFind the sum to n terms of the series , 5+11+19+29+41…
View Solutioncosθ.Cosecθ=cotθ
View SolutionThe area bounded by the curves y=√x ; 2y+3=x and x− axis in the 4th quadrant is
View SolutionDetermine the point of symmetry of a regular hexagon.
View SolutionDtermine the images of the following figure about the given line :
View SolutionMatch the following Column A to Column B

View SolutionMatch the following Column A to Column B

View SolutionMatch the following Column A to Column B

View SolutionThe inequation represented by the graph given below is :
View SolutionThe inequation that best describes the graph given below is _________
View SolutionThe inequation that best describes the following graph is _________
View SolutionWhich inequations represent the shaded region in the given figure
View Solution