The following are weights (in kg) of 50 children taken at the time of birth:

Make an inclusive form grouped frequency distribution table with 0.3 kg as the width of ' each class.
Also, find the true class limits of each class.
The correct Answer is:True class limits are 1.95-2.35, 2.35-2.75, 2.75-3.15, 3.15-3.55, 3.55-3.95, 3.95-4.35, 4.35-4.75
Step by step video, text & image solution for The following are weights (in kg) of 50 children taken at the time of birth: Make an inclusive form grouped frequency distribution table with 0.3 kg as the width of ' each class. Also, find the true class limits of each class. by Maths experts to help you in doubts & scoring excellent marks in Class 9 exams.
Updated on:21/07/2023Topper's Solved these Questions
- STATISTICSBOOK - NAGEEN PRAKASHANCHAPTER - STATISTICSEXERCISE - Exercise 14c
20 Videos
- STATISTICSBOOK - NAGEEN PRAKASHANCHAPTER - STATISTICSEXERCISE - Revision Exercise
10 Videos
- STATISTICSBOOK - NAGEEN PRAKASHANCHAPTER - STATISTICSEXERCISE - Problems From NCERT/exemplar
22 Videos
- QUADRILATERALSBOOK - NAGEEN PRAKASHANCHAPTER - QUADRILATERALSEXERCISE - Revision Exercise (long Answer Questions)
5 Videos
- SURFACE AREA AND VOLUMEBOOK - NAGEEN PRAKASHANCHAPTER - SURFACE AREA AND VOLUMEEXERCISE - Revision Exercise (long Answer Questions)
10 Videos
Similar Questions
Knowledge Check
In a frequency distribution, the mid-value of a class is 10 and width of each class is 6. The upper limit of the class is
A13B7C8D12The width of each of five continuous classes in a frequency distribution is 5 and the lower class limit of the lowest class is 10. The upper class limit of the highest class is
A15B25C35D40The width of each of the five continuous classes in a frequency distribution is 5 and the upper class limit of the last class is 60. The lower class limit of the lowest class is
A45B25C35D40
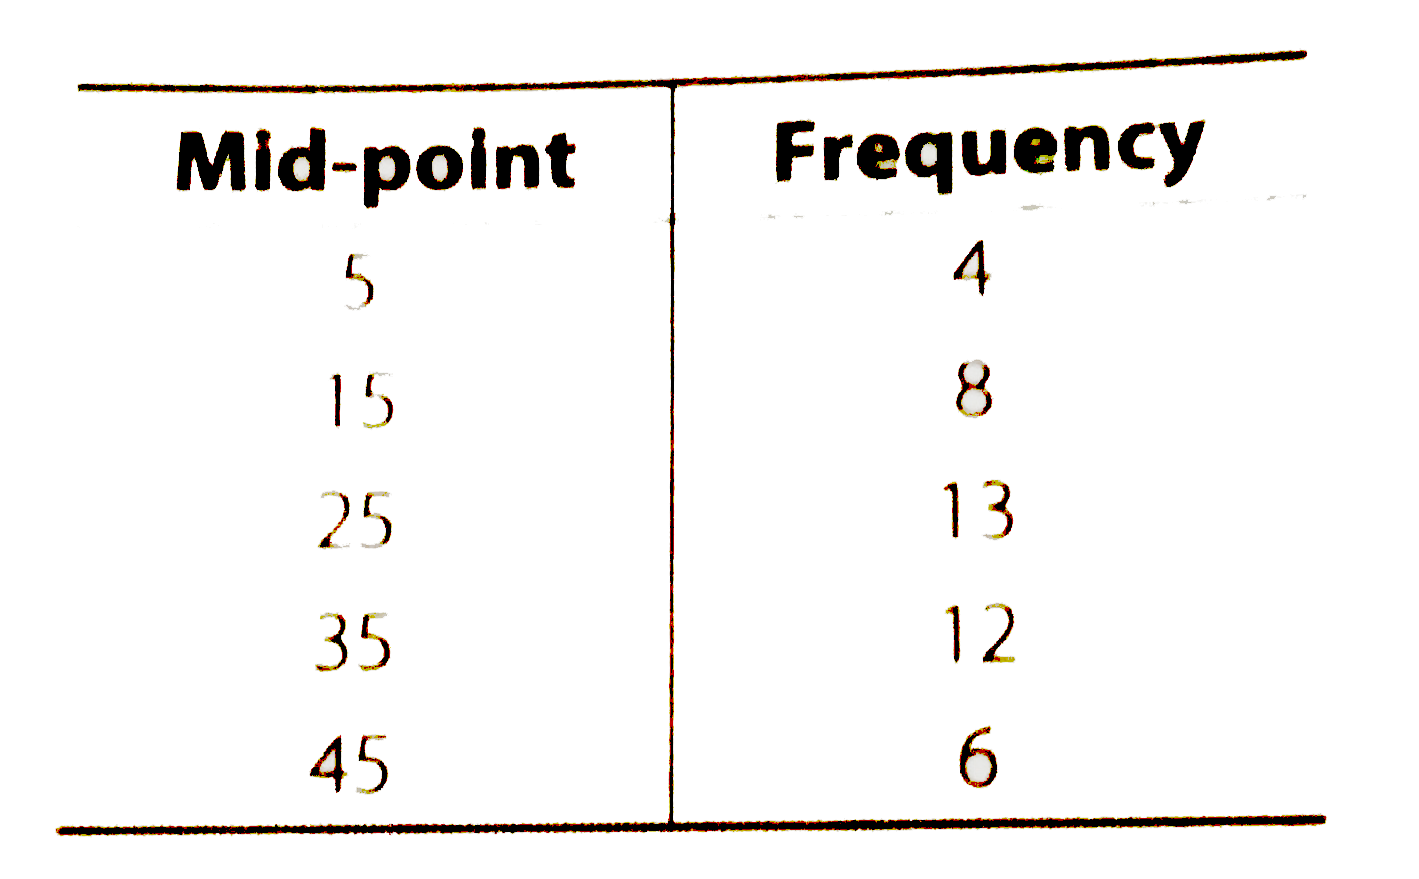
Let us now consider the following frequency distribution table which gives the weights of 38 students of a class:
View SolutionPrepare a continuous grouped frequency distribution from the following data

Also, find the size of class intervals.
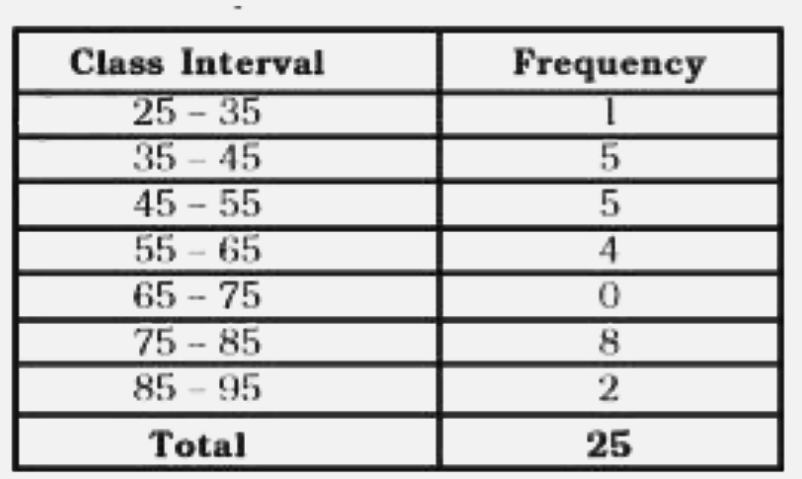
View SolutionRead the frequency distribution table given below and answer the questions that follow:

What is the lower limit of the last class?
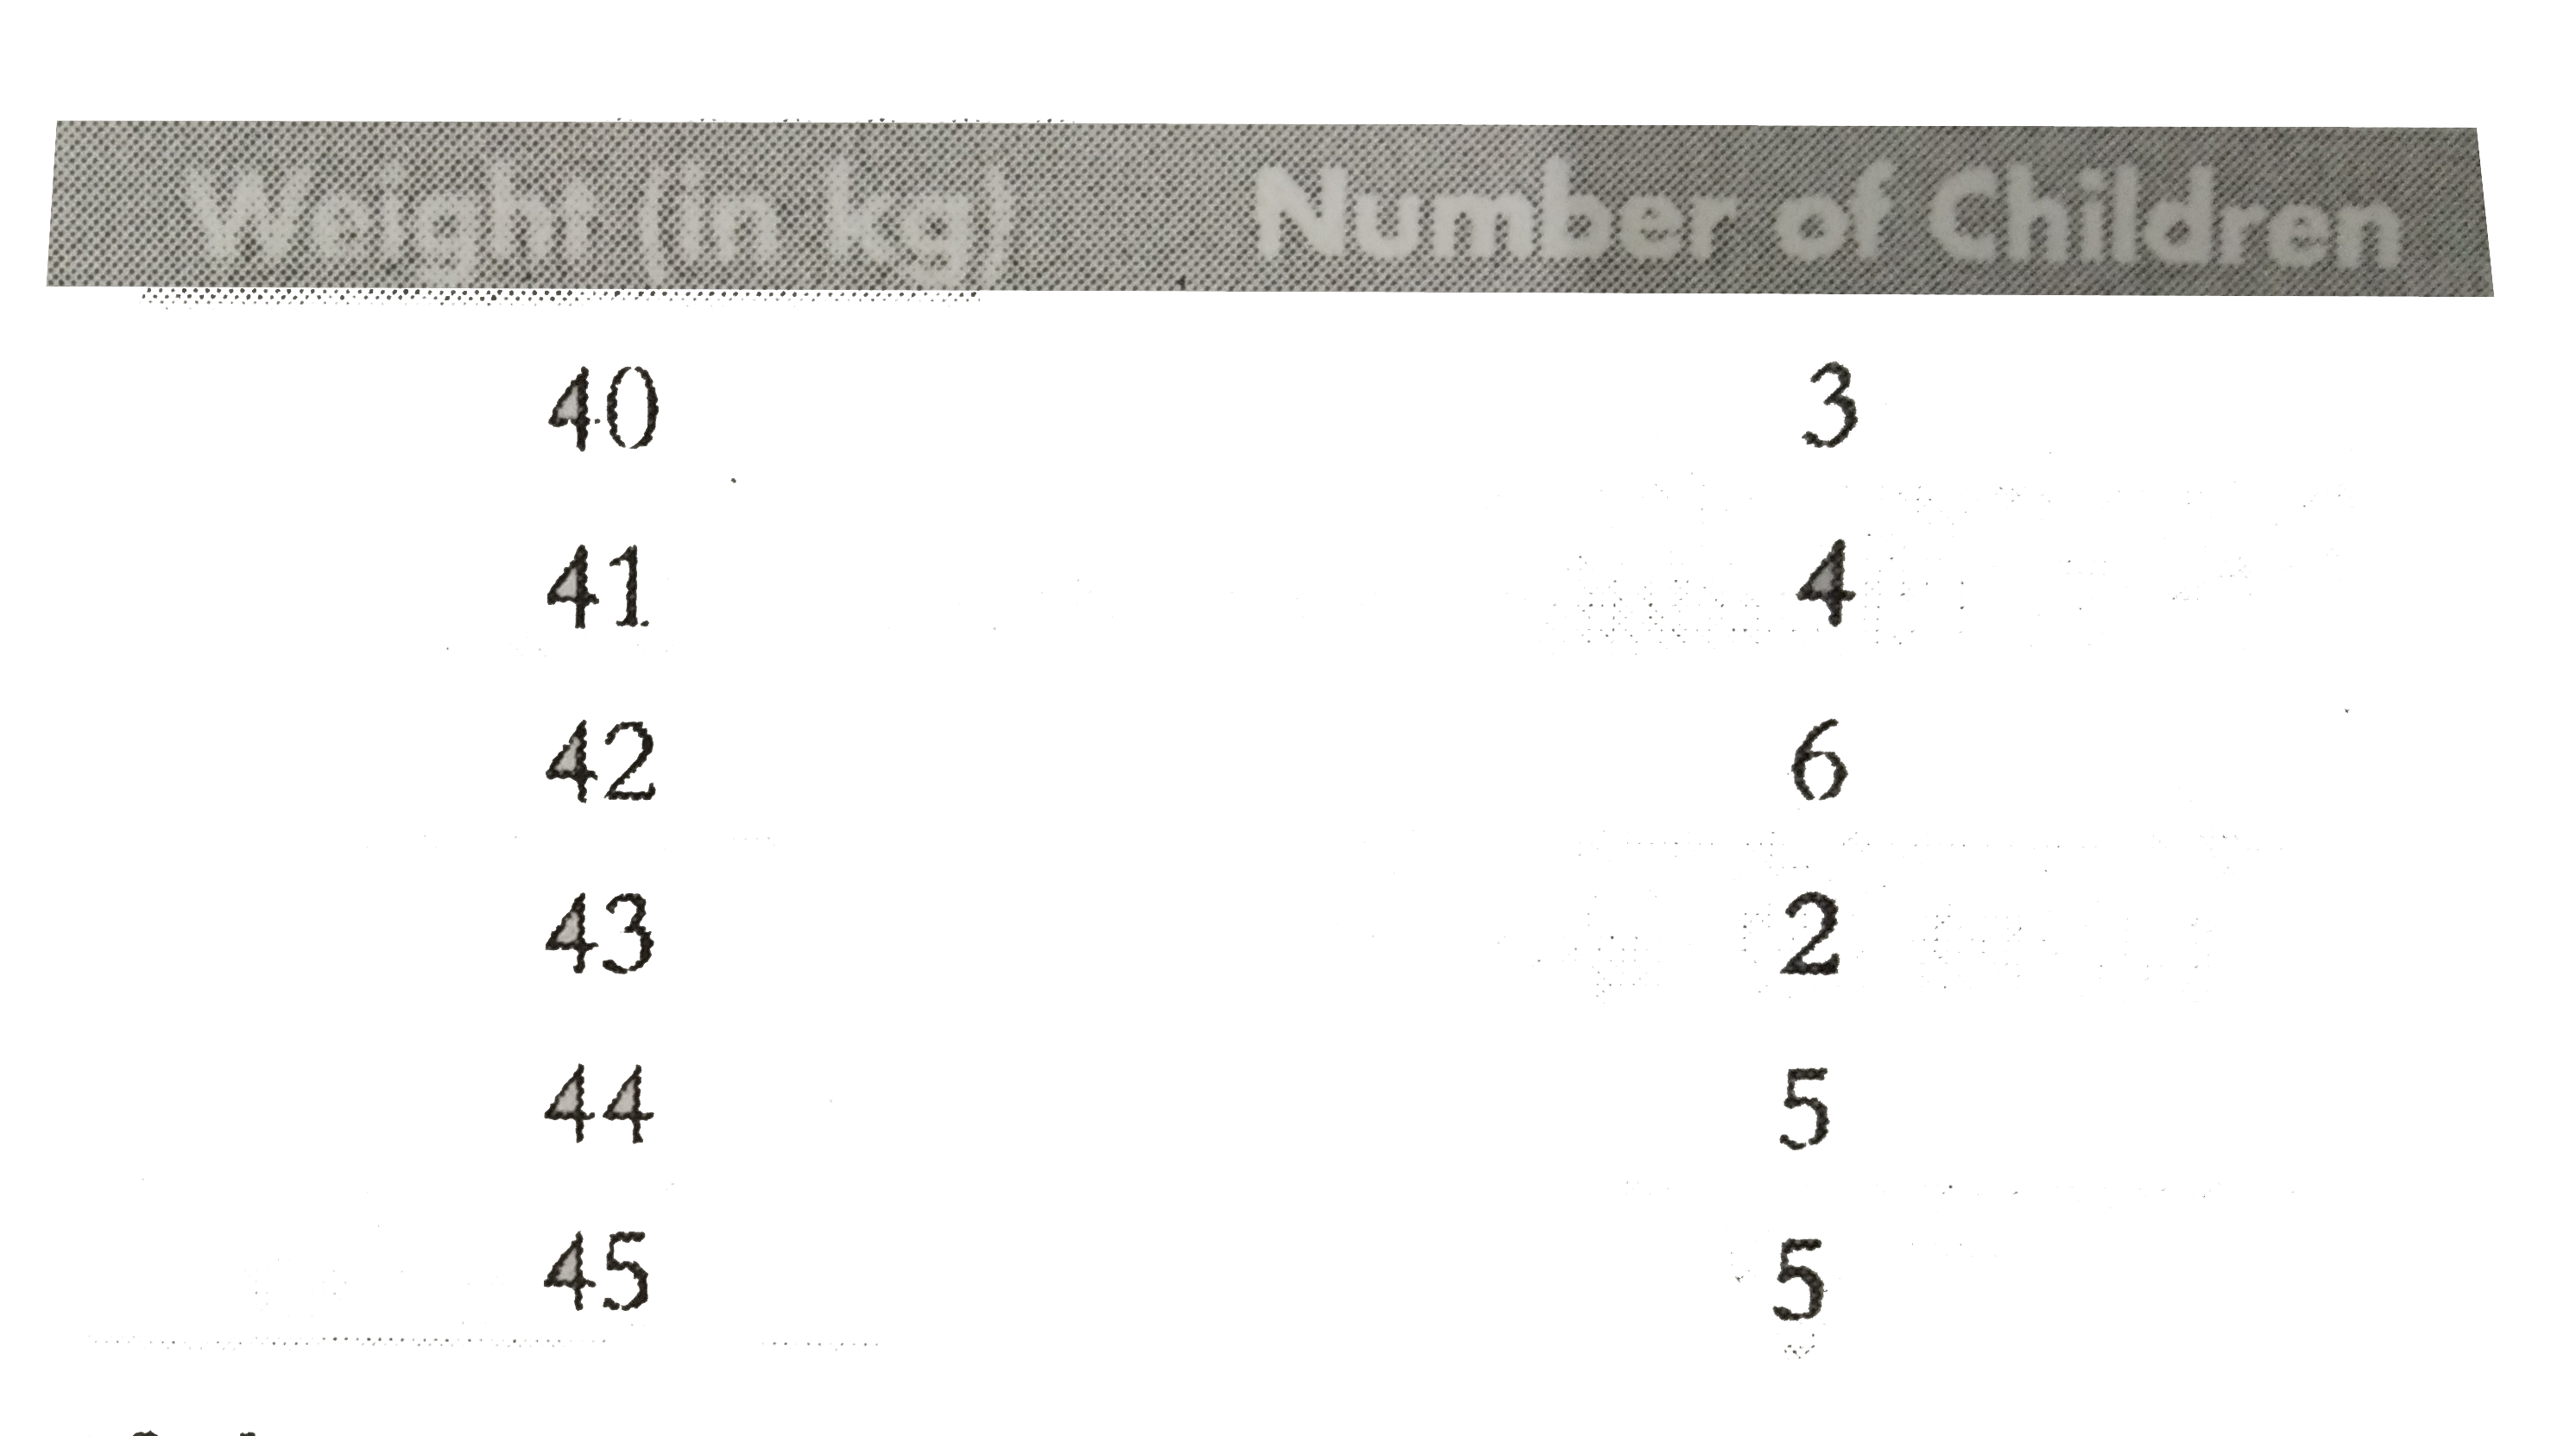
View SolutionThe weight (in kg ) of 25 children of 9th class is given . Find the mean weight of the children .

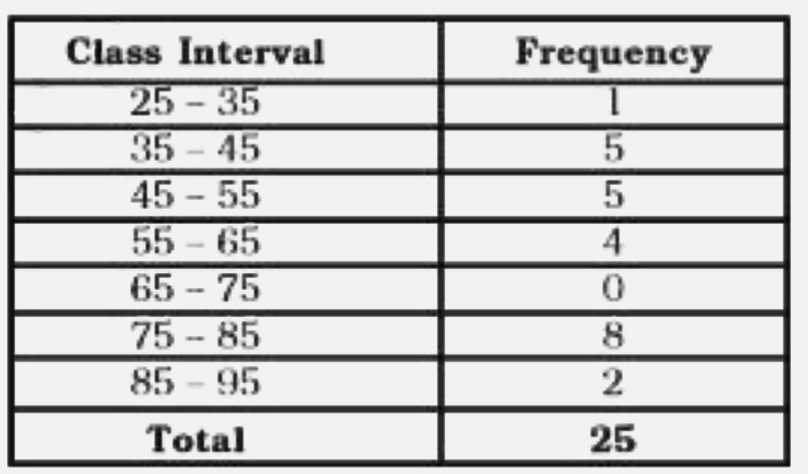
View SolutionIn the following frequency distribution, find the median class.

What is the lower limit of model class ?
View Solution

