The following diagram show the expenditure of a family on various Items A ,B,C, D and E .
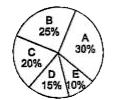
Study the diagram carefully and answer the following questions .
If the income of the family is Rs 3000 per month then expenditure on item C will be
Rs 400
Rs 500
Rs 600
Rs 800
The correct Answer is:C
Step by step video, text & image solution for The following diagram show the expenditure of a family on various Items A ,B,C, D and E . Study the diagram carefully and answer the following questions . If the income of the family is Rs 3000 per month then expenditure on item C will be by Maths experts to help you in doubts & scoring excellent marks in Class 12 exams.
Updated on:21/07/2023Topper's Solved these Questions
- STATISTICS BOOK - ARIHANT PUBLICATION JHARKHANDCHAPTER - STATISTICS EXERCISE - Exam Booster for Cracking Exam
25 Videos
- SOLVED PAPER 2019BOOK - ARIHANT PUBLICATION JHARKHANDCHAPTER - SOLVED PAPER 2019EXERCISE - SECTION I: MATHEMATICS
48 Videos
- TAXATION BOOK - ARIHANT PUBLICATION JHARKHANDCHAPTER - TAXATION EXERCISE - EXAM BOOSTER
14 Videos
Similar Questions
Knowledge Check
The following diagram show the expenditure of a family on various Items A ,B,C, D and E .
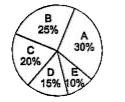
Study the diagram carefully and answer the following questions .
The angle of pie diagram showing the expenditure incurred on item A isA30∘B35∘C108∘DNone of theseThe following diagram show the expenditure of a family on various Items A ,B,C, D and E .

Study the diagram carefully and answer the following questions .
The angle of pie diagram showing the expenditure incurred on item A isA30∘B35∘C108∘DNone of theseThe following diagram show the expenditure of a family on various Items A ,B,C, D and E .
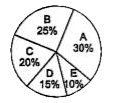
Study the diagram carefully and answer the following questions .
Which two expenditure together will form an angle of 90∘ at the centre of pie diagram ?AD and EBA and DCA and EDD and C
The following diagram show the expenditure of a family on various Items A ,B,C, D and E .

Study the diagram carefully and answer the following questions .
Which two expenditure together will form an angle of 90∘ at the centre of pie diagram ?
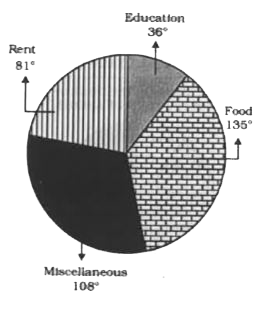
View SolutionThe pie chart given below shows the spending of a family on various heads during a month. Study the graph and answer the following questions.
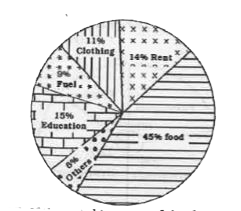
If the total income of the family is Rs 25,000, then the amount spent on Rent and Food together is
View SolutionThe following pie-chart shows the monthly expenditure of a family on various items. If the family spends Rs. 825 on clothing, answer the question
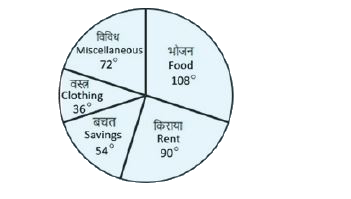
What is the total monthly income of the family?
View SolutionThe following pie-chart shows the monthly expenditure of a family on various items. If the family spends Rs. 825 on clothing, answer the question
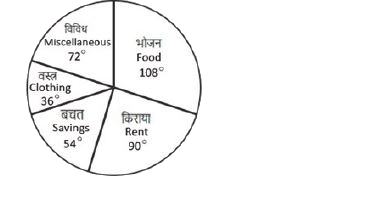
What percent of the total income does the family save ?
View SolutionThe pie chart given here represents the domestic expenditure of a family in per cent. Study the chart and answer the following questions if the total monthly income of the family is Rs 33,650.
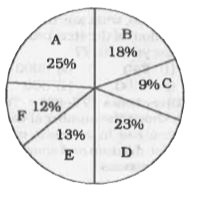
A : Expenditure on food
B : Expenditure on house-rent
C : Expenditure on entertainment
D : Expenditure on education and maintenance of children
E : Medical and miscellaneous expenditure
F : Deductions towards provident fund
The total amount per month, the family spends on food and entertainment combined together, is :
View Solution

