The following table gives production yield per hectare of wheat of 100 farms of a village.

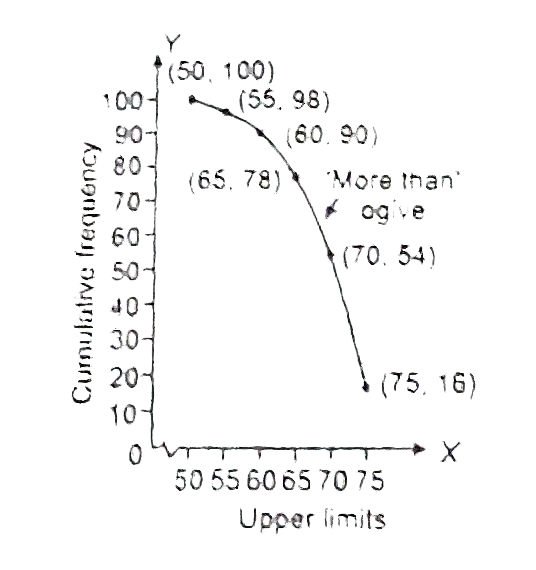
Change the distribution to a more than type distribution, and draw its ogive

Now, we will draw the ogive by plotting the points (50,100),(55,98),(60,90),(65,78), (70,54) and (75,16)

Topper's Solved these Questions
- STATISTICS BOOK - NAGEEN PRAKASHAN ENGLISHCHAPTER - STATISTICS EXERCISE - Exercise 14 A
17 Videos
- STATISTICS BOOK - NAGEEN PRAKASHAN ENGLISHCHAPTER - STATISTICS EXERCISE - Exercise 14 B
7 Videos
- STATISTICS BOOK - NAGEEN PRAKASHAN ENGLISHCHAPTER - STATISTICS EXERCISE - Revision Exercise Long Answer Questions
4 Videos
- SOME APPLICATIONS OF TRIGONOMETRYBOOK - NAGEEN PRAKASHAN ENGLISHCHAPTER - SOME APPLICATIONS OF TRIGONOMETRYEXERCISE - Long Answer Questions
5 Videos
- TRIANGLES BOOK - NAGEEN PRAKASHAN ENGLISHCHAPTER - TRIANGLES EXERCISE - Revision Exercise Long Questions
1 Videos
Similar Questions
The following table gives the production yield per hectare of wheat of 100 farms of a village. Change the given distribution to more than type distribution and draw its ogive
View SolutionThe following table gives production yield per hectare of wheat of 100 farms of a village: Production yield 50-55 55-60 60-65 65-70 70-75 75-80 in kg per hectare: No. of farms: 2 8 12 24 38 16 Draw ‘less than’ ogive and ‘more than’ ogive.
View Solution
Knowledge Check
The abscissa of the point of intersection of less than type and more than type ogives gives its
AmeanBmodeCmedianDall the three measures
The following table gives the distribution of 100 families according to expenditure. If mode of the distribution is 124, find the missing frequencies.

View SolutionThe following table shows the distribution of the heights of a group of students:

Use a graph sheet to draw an Ogive for the distribution. Use the Ogive to find:
the inter quartile range
View SolutionThe following table shows the distribution of the heights of a group of students:

Use a graph sheet to draw an Ogive for the distribution. Use the Ogive to find:
the number of students whose height is more than 168 cm
View SolutionThe following table shows the distribution of the heights of a group of students:

Use a graph sheet to draw an Ogive for the distribution. Use the Ogive to find:
the number of students whose height is less than 148 cm.
View SolutionThe following is the distribution of weights (in kg) of 40 persons.

Construct a cumulative frequency distribution (of the less than type) table for the data above.
View SolutionThe following distribution gives the daily income of 50 workers of a factory: Daily income (in Rs): 100-120 120-140 140-160 160-180 180-200 Number of workers: 12 14 8 6 10 Convert the above distribution to a less than type cumulative frequency distribution and draw its ogive.
View SolutionDraw a 'less than' give for the following frequency distribution :

View Solution
