The following table gives the production yield per hectare of wheat of 100 farms of a village. Change the given distribution to more than type distribution and draw its ogive
Please refer to video for this question.
Similar Questions
The following table gives production yield per hectare of wheat of 100 farms of a village.

Change the distribution to a more than type distribution, and draw its ogiveView SolutionThe following table gives production yield per hectare of wheat of 100 farms of a village: Production yield 50-55 55-60 60-65 65-70 70-75 75-80 in kg per hectare: No. of farms: 2 8 12 24 38 16 Draw ‘less than’ ogive and ‘more than’ ogive.
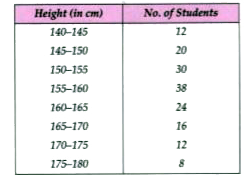
View SolutionThe following table shows the distribution of the heights of a group of students:

Use a graph sheet to draw an Ogive for the distribution. Use the Ogive to find:
the inter quartile rangeView SolutionThe following table gives the distribution of 100 families according to expenditure. If mode of the distribution is 124, find the missing frequencies.
 View Solution
The following distribution represents the height of 160 students of a school.

Draw an ogive for the given distribution taking 2 cm = 5 cm of height on one axis and 2 cm = 20 cm students on the other axis. Using the graph, determine.
(i) The median height.View SolutionThe following table shows the distribution of the heights of a group of students:

Use a graph sheet to draw an Ogive for the distribution. Use the Ogive to find:
the number of students whose height is more than 168 cmView SolutionThe following table shows the distribution of the heights of a group of students:

Use a graph sheet to draw an Ogive for the distribution. Use the Ogive to find:
the number of students whose height is less than 148 cm.View SolutionThe following is the distribution of weights (in kg) of 40 persons.

Construct a cumulative frequency distribution (of the less than type) table for the data above.View SolutionDraw a 'less than' give for the following frequency distribution :
 View Solution
The following distribution gives the daily income of 50 workers of a factory: Daily income (in Rs): 100-120 120-140 140-160 160-180 180-200 Number of workers: 12 14 8 6 10 Convert the above distribution to a less than type cumulative frequency distribution and draw its ogive.
View Solution

