The following table shows the frequency distribution of heights of 50 boys: Find the mode of heights
The correct Answer is:122cm
Step by step video & image solution for The following table shows the frequency distribution of heights of 50 boys: Find the mode of heights by Maths experts to help you in doubts & scoring excellent marks in Class 10 exams.
Updated on:21/07/2023Topper's Solved these Questions
- MEASURES OF CENTRAL TENDENCY (MEAN, MEDIAN, QUARTILES AND MODE)BOOK - ICSECHAPTER - MEASURES OF CENTRAL TENDENCY (MEAN, MEDIAN, QUARTILES AND MODE)EXERCISE - EXERCISE 24 (E)
23 Videos
- MEASURES OF CENTRAL TENDENCY (MEAN, MEDIAN, QUARTILES AND MODE)BOOK - ICSECHAPTER - MEASURES OF CENTRAL TENDENCY (MEAN, MEDIAN, QUARTILES AND MODE)EXERCISE - EXERCISE 24 (C)
10 Videos
- MATRICESBOOK - ICSECHAPTER - MATRICESEXERCISE - Exercise 9D
25 Videos
- MIXED PRACTICE BOOK - ICSECHAPTER - MIXED PRACTICE EXERCISE - SET B
52 Videos
Similar Questions
Given below is the frequency distribution of the heights of playces in a school :

Find the modal height
View SolutionThe following table shows the expenditure of 60 boys on books. Find the mode of their expenditure:
View SolutionThe following table shows the distribution of the heights of a group of students:

Use a graph sheet to draw an Ogive for the distribution. Use the Ogive to find:
the inter quartile range
View SolutionThe following table shows the distribution of the heights of a group of students:

Use a graph sheet to draw an Ogive for the distribution. Use the Ogive to find:
the number of students whose height is more than 168 cm
View SolutionThe following table shows the distribution of the heights of a group of students:

Use a graph sheet to draw an Ogive for the distribution. Use the Ogive to find:
the number of students whose height is less than 148 cm.
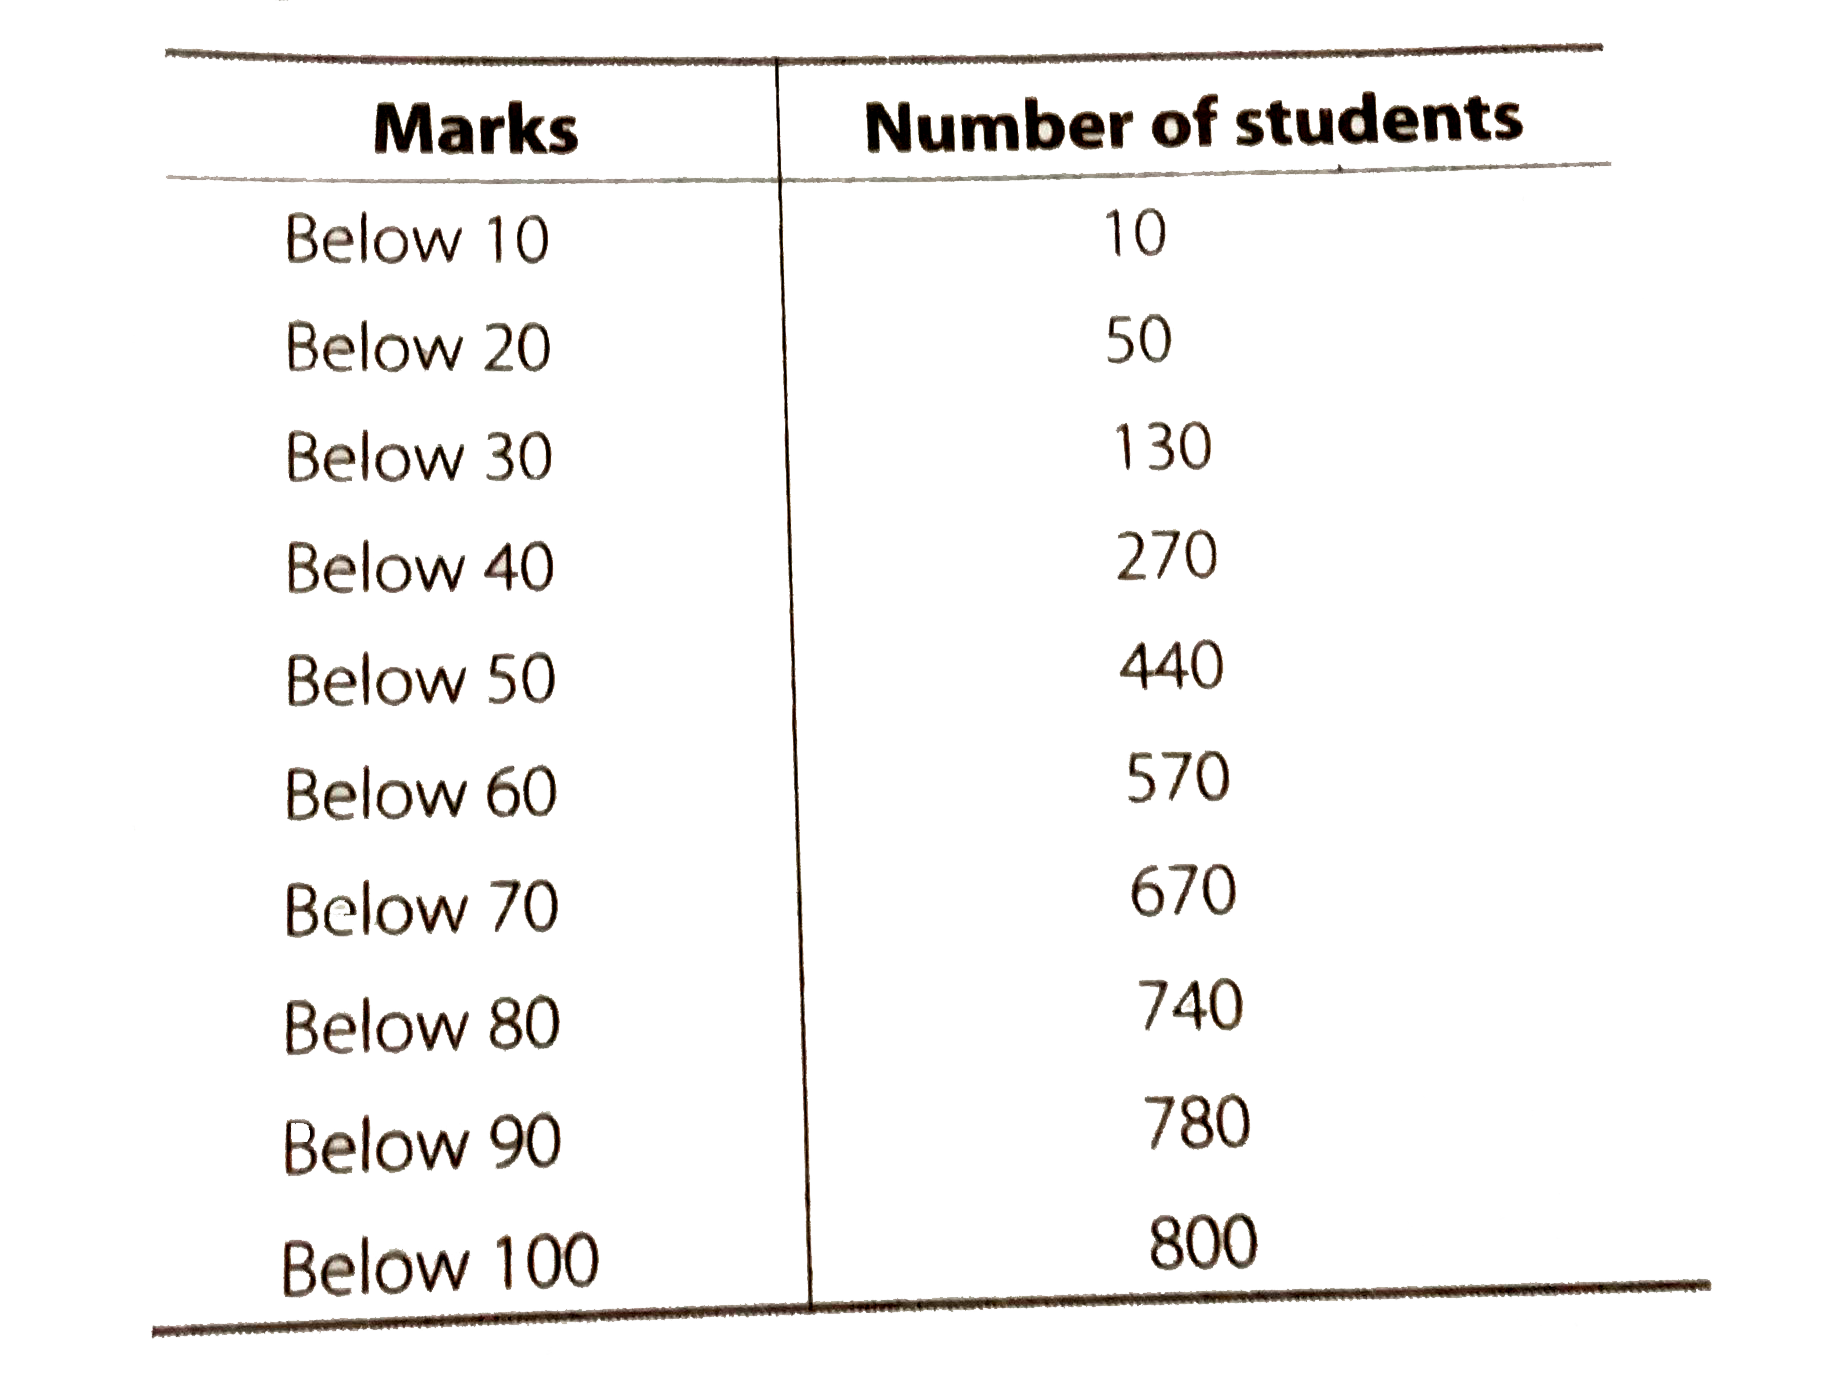
View SolutionThe following table show tha cumulative frequency distribution of marks of 800 students in an examination.

Construct a frequency distribution table for the data above.
View SolutionThe following table shows the distribution of heights of a group of factory workers.

Determine the cumulative frequencies.
View SolutionThe mode for the following frequency distribution :

View SolutionThe following table shows the distribution of the heights of a group of factory workers :
Determine the cumulative frequencies
Ht. (cm): 150−155155−160160−165165−170170−175175−180180−185 No. of workers 6 12 18 20 13 8 6
View SolutionFind the unknown entries (a,b,c,d,e,f,g) from the following frequency distribution of heights of 50 students in a class: Class intervals (heights in cm) Frequency Cumulative Frequency 150-155 155-160 160-165 165-170 170-175 175-180 12 b 10 d e 2 a 25 c 43 48 f
View Solution
