The following table shows the information the milk collected from farmers on a milk collection centre and the content of fat in the milk,measured by a lactometer.Find the mode of fat content.
The correct Answer is:4.33
Topper's Solved these Questions
- STATISTICS BOOK - UNIQUE PUBLICATIONCHAPTER - STATISTICS EXERCISE - PRACTICE SET 6.4
4 Videos
- STATISTICS BOOK - UNIQUE PUBLICATIONCHAPTER - STATISTICS EXERCISE - PRACTICE SET 6.5
3 Videos
- STATISTICS BOOK - UNIQUE PUBLICATIONCHAPTER - STATISTICS EXERCISE - PRACTICE SET 6.2
4 Videos
- SIMILARITYBOOK - UNIQUE PUBLICATIONCHAPTER - SIMILARITYEXERCISE - Assignment-I
5 Videos
- TRIGONOMETRYBOOK - UNIQUE PUBLICATIONCHAPTER - TRIGONOMETRYEXERCISE - ASSIGNMENT
12 Videos
Similar Questions
The following table shows the information regarding the milk collected from farmers on a milk collection centre and the content of fat in the milk, measured by a lactometer. Find the mode of fat content.

View SolutionThe following table shows the information regarding the milk collected from farmers on a milk collection centre and the content of fat in the milk, measured by a lactometer. Find the mode of fat content.

View Solution
Knowledge Check
What is the average fat content of buffalo milk ?
A0.072B0.045C0.09D0.109The milk of which one of these has more fat content
ACowBBuffaloCSheepDGoatWhat is the average fat content in buffalow milk?
A7.2%B4.5%C9.%D10.0%
Describe the following processes briefly :
(a) Coagulation of milk
(b) Role of bile salts ion digestion and absorption of fats.
View SolutionThe following table shows the percentage of vehicles passing a signal. Find out the measures of the central angles to show the information by a pie diagram. Hence draw the pie diagram.

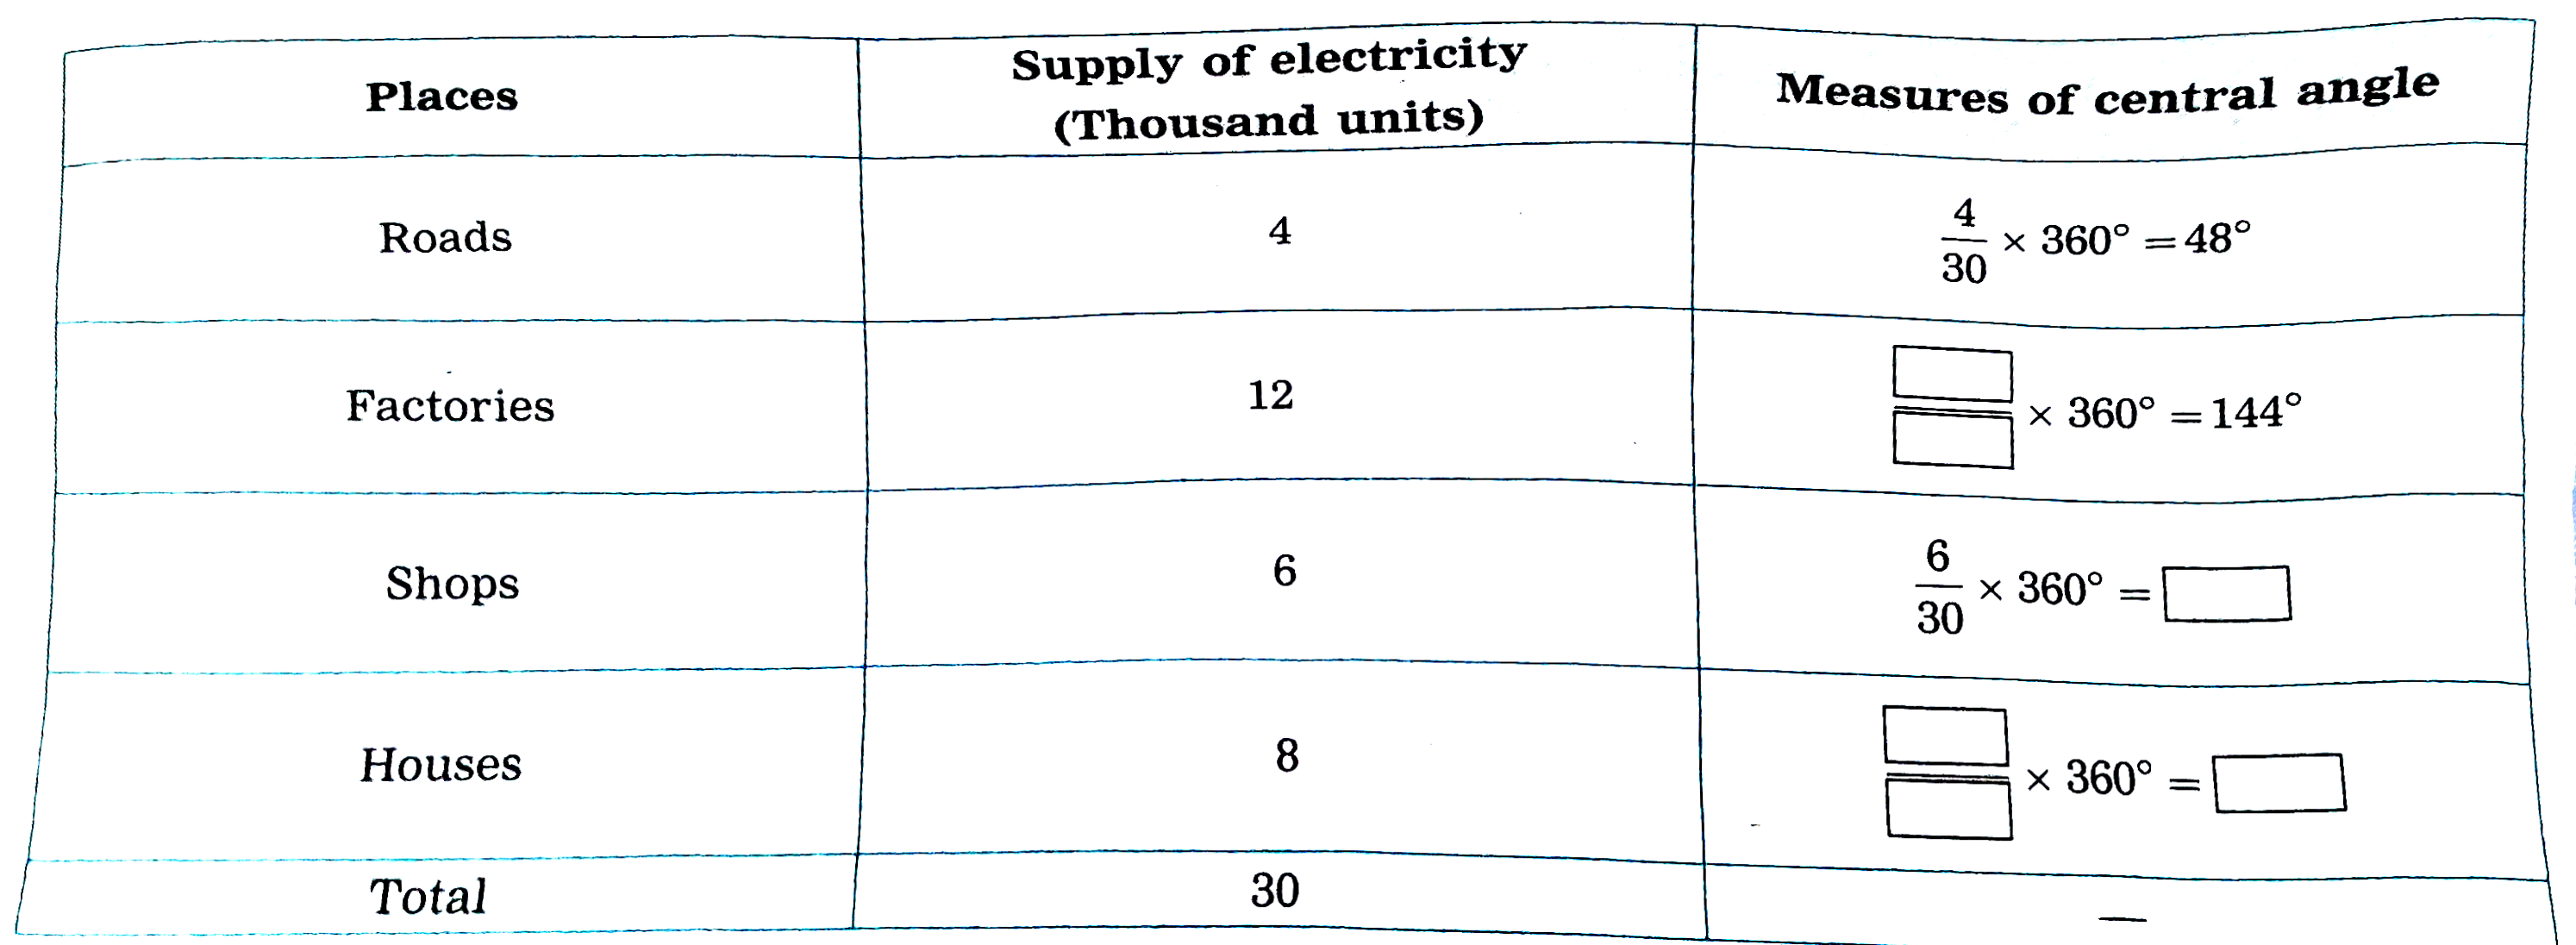
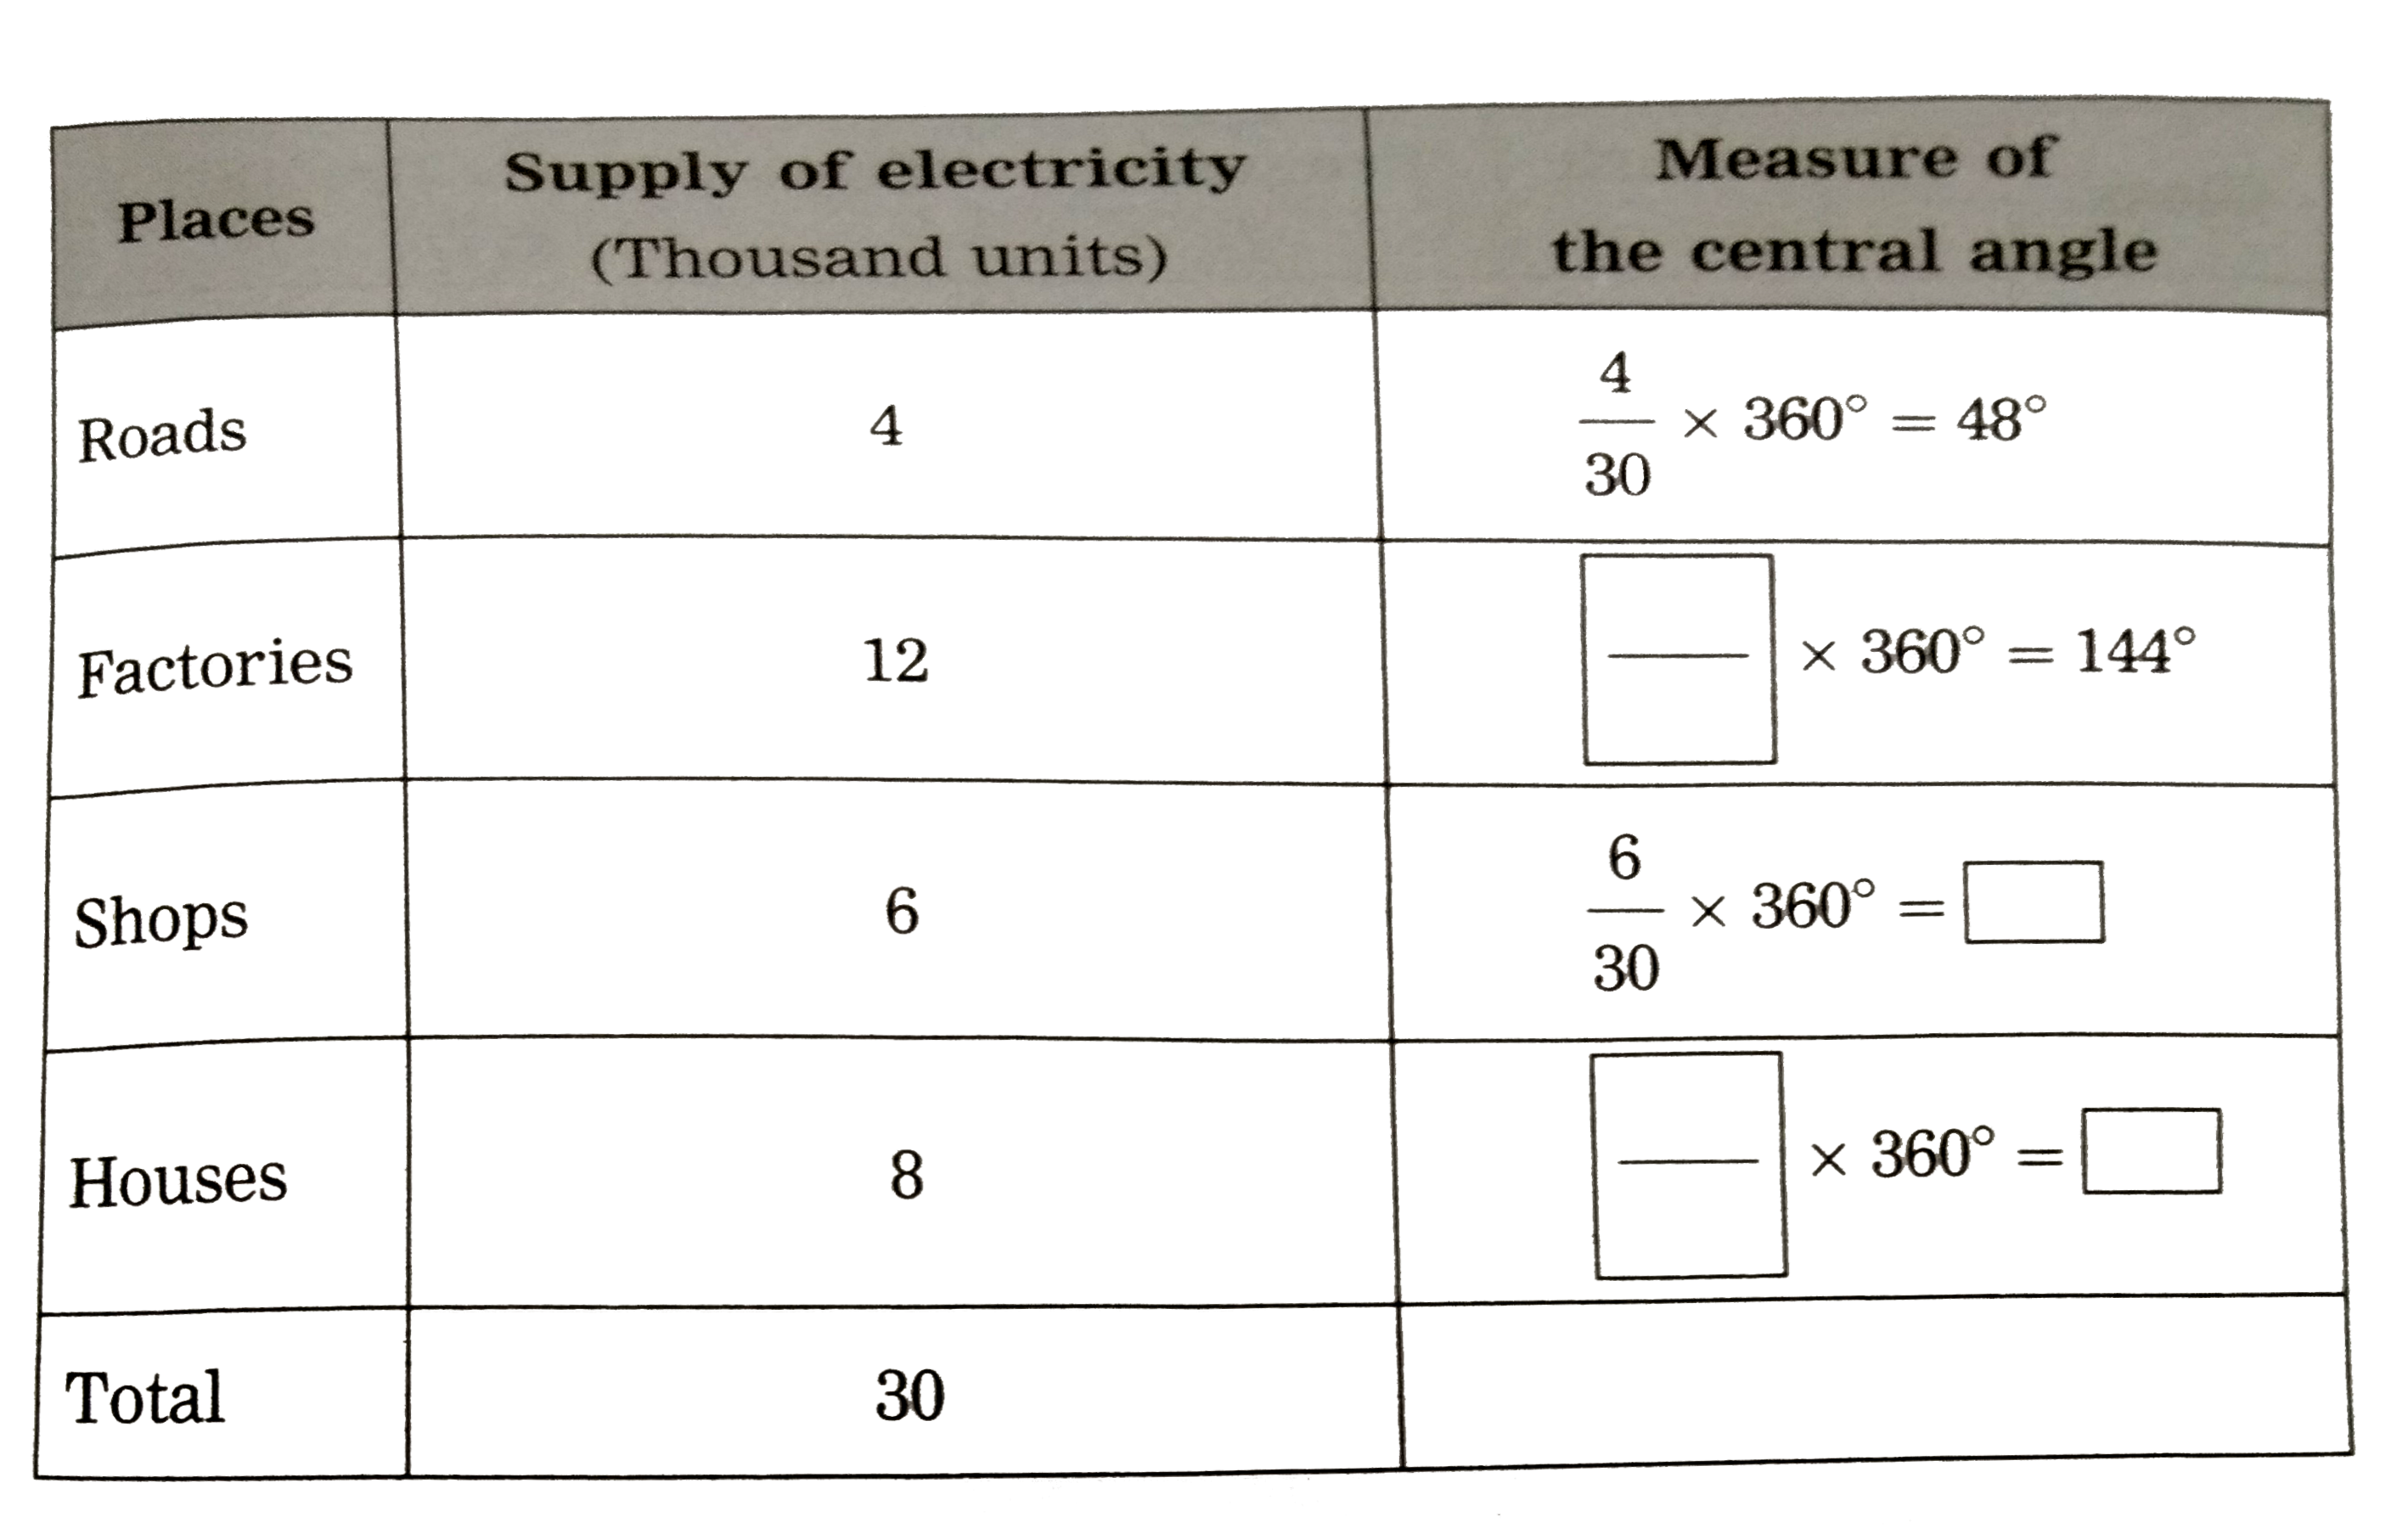
View SolutionThe following table shows the daily supply of electricity to different places in a town. To show the information by a pie diagram measure of central angles of sectors are to be decided. Complete the following activity to find the measures:

View SolutionThe following table shows the daily supply of electricity to differenet places in a town. To show the information by a pie diagram, measures of central angles of sectors are to be decided. Complete the following activity to find the measures.

View SolutionThe vitamin whos content increases following the conversion of milk into curd by lactic acid bacteria is
View Solution
