The given table shows the production of three different types of cars over the years. Study it carefully and answer the following question.
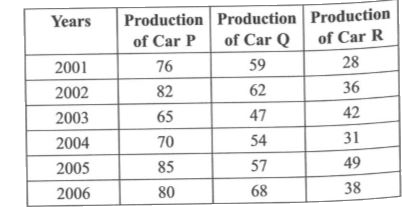
The average production of which of the following types of cars was maximum ?
Q
P
R
Cant'be determined
The correct Answer is:B
Step by step video, text & image solution for The given table shows the production of three different types of cars over the years. Study it carefully and answer the following question. The average production of which of the following types of cars was maximum ? by Maths experts to help you in doubts & scoring excellent marks in Class 7 exams.
Updated on:21/07/2023Topper's Solved these Questions
- IMO QUESTION PAPER 2019-20 SET BBOOK - SCIENCE OLYMPIAD FOUNDATION CHAPTER - IMO QUESTION PAPER 2019-20 SET BEXERCISE - Everday mathematics
10 Videos
- IMO QUESTION PAPER 2019-20 SET BBOOK - SCIENCE OLYMPIAD FOUNDATION CHAPTER - IMO QUESTION PAPER 2019-20 SET BEXERCISE - Achievers section
5 Videos
- IMO QUESTION PAPER 2019-20 SET ABOOK - SCIENCE OLYMPIAD FOUNDATION CHAPTER - IMO QUESTION PAPER 2019-20 SET AEXERCISE - ACHIEVERS SECTION
5 Videos
- IMO QUESTION PAPER 2020-21 SET ABOOK - SCIENCE OLYMPIAD FOUNDATION CHAPTER - IMO QUESTION PAPER 2020-21 SET AEXERCISE - ACHIEVERS SECTION
5 Videos
Similar Questions
The table shows the production of different types of cars (in thousands). Study the table carefully and answer the questions

The number of years, in which the production of cars of type B is less than the average production of type D cars ovee the years is :
View SolutionThe table shows the production of different types of cars (in thousands). Study the table carefully and answer the questions

What is the ratio of the total production of cars ot type A in 2014 and type C in 2013 taken together to the total production of cars of type B in 2016 and type E in 2015 taken together?
View Solution
Knowledge Check
Study the graph and answer the following questions-
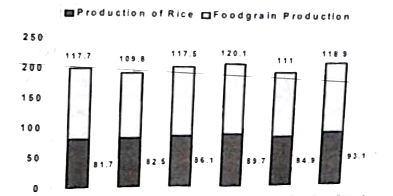
Over the given years what is average production of rice?A86.33 million tonnesB88.66 million tonnesC85 million tonnesD88 million tonnesThe table shows the production of different types of cars by a company (in thousands) in 5 years. Study the table and answer the questions.
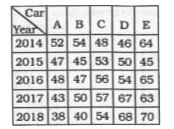
The average production of type D cars in 5 years is what per cent less than the production of type E cars in 2018 ? (Correct to one decimal place)A18.6B16.8C15.9D17.4The table shows the production of different types of cars by a company (in thousands) in 5 years. Study the table and answer the questions.
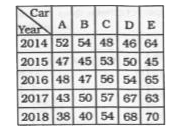
The total production of type B cars in all the five years is what per cent more than the total production of types A, B and D cars in 2017 ?A(a) 49.5B(b) 47.5C(c) 57.3D(d) 32.2
The table shows the production of different types of cars (in thousands). Study the table carefully and answer the questions

If the data related to the production of cars of type E is represented by a pie chart, then the central angle of the sector representing the data of production of cars in 2013 will be :
View SolutionThe following graph shows the production of wheat flour (in 1000 tonnes) by three companies X, Y and Z over the years. Study the graph and answer the questions.
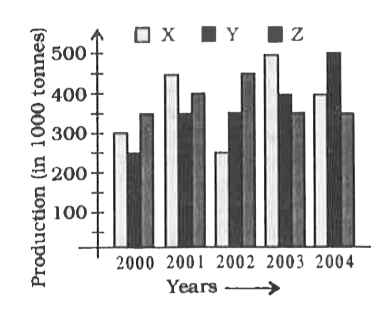
The average production for five years was maximum for which company ?
View SolutionThe table shows the production of different types of cars by a company (in thousands) in 5 years. Study the table and answer the questions.
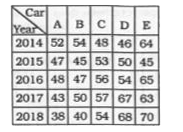
What is the ratio of the total production of type C cars in 2015 and type D cars in 2017 taken together to the total production of type B cars in 2016 and type A cars in 2017 taken together ?
View SolutionThe time table below shows production of five types of cars by a company from the year 1998 to 2003. Study the table and answer the question.
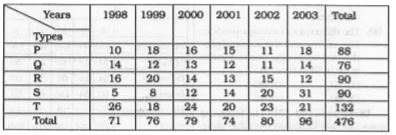
In which year the production of cars of all types taken together was approximately equal to the average of the total production during the period:
View SolutionThe table given here shows production of five types of cars by a company in the year 1989 to 1994. Study the table and answer questions
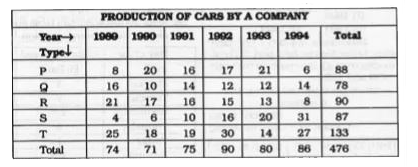
The production of which type of car was 25% of the total production of all types of cars during 1993?
View Solution
