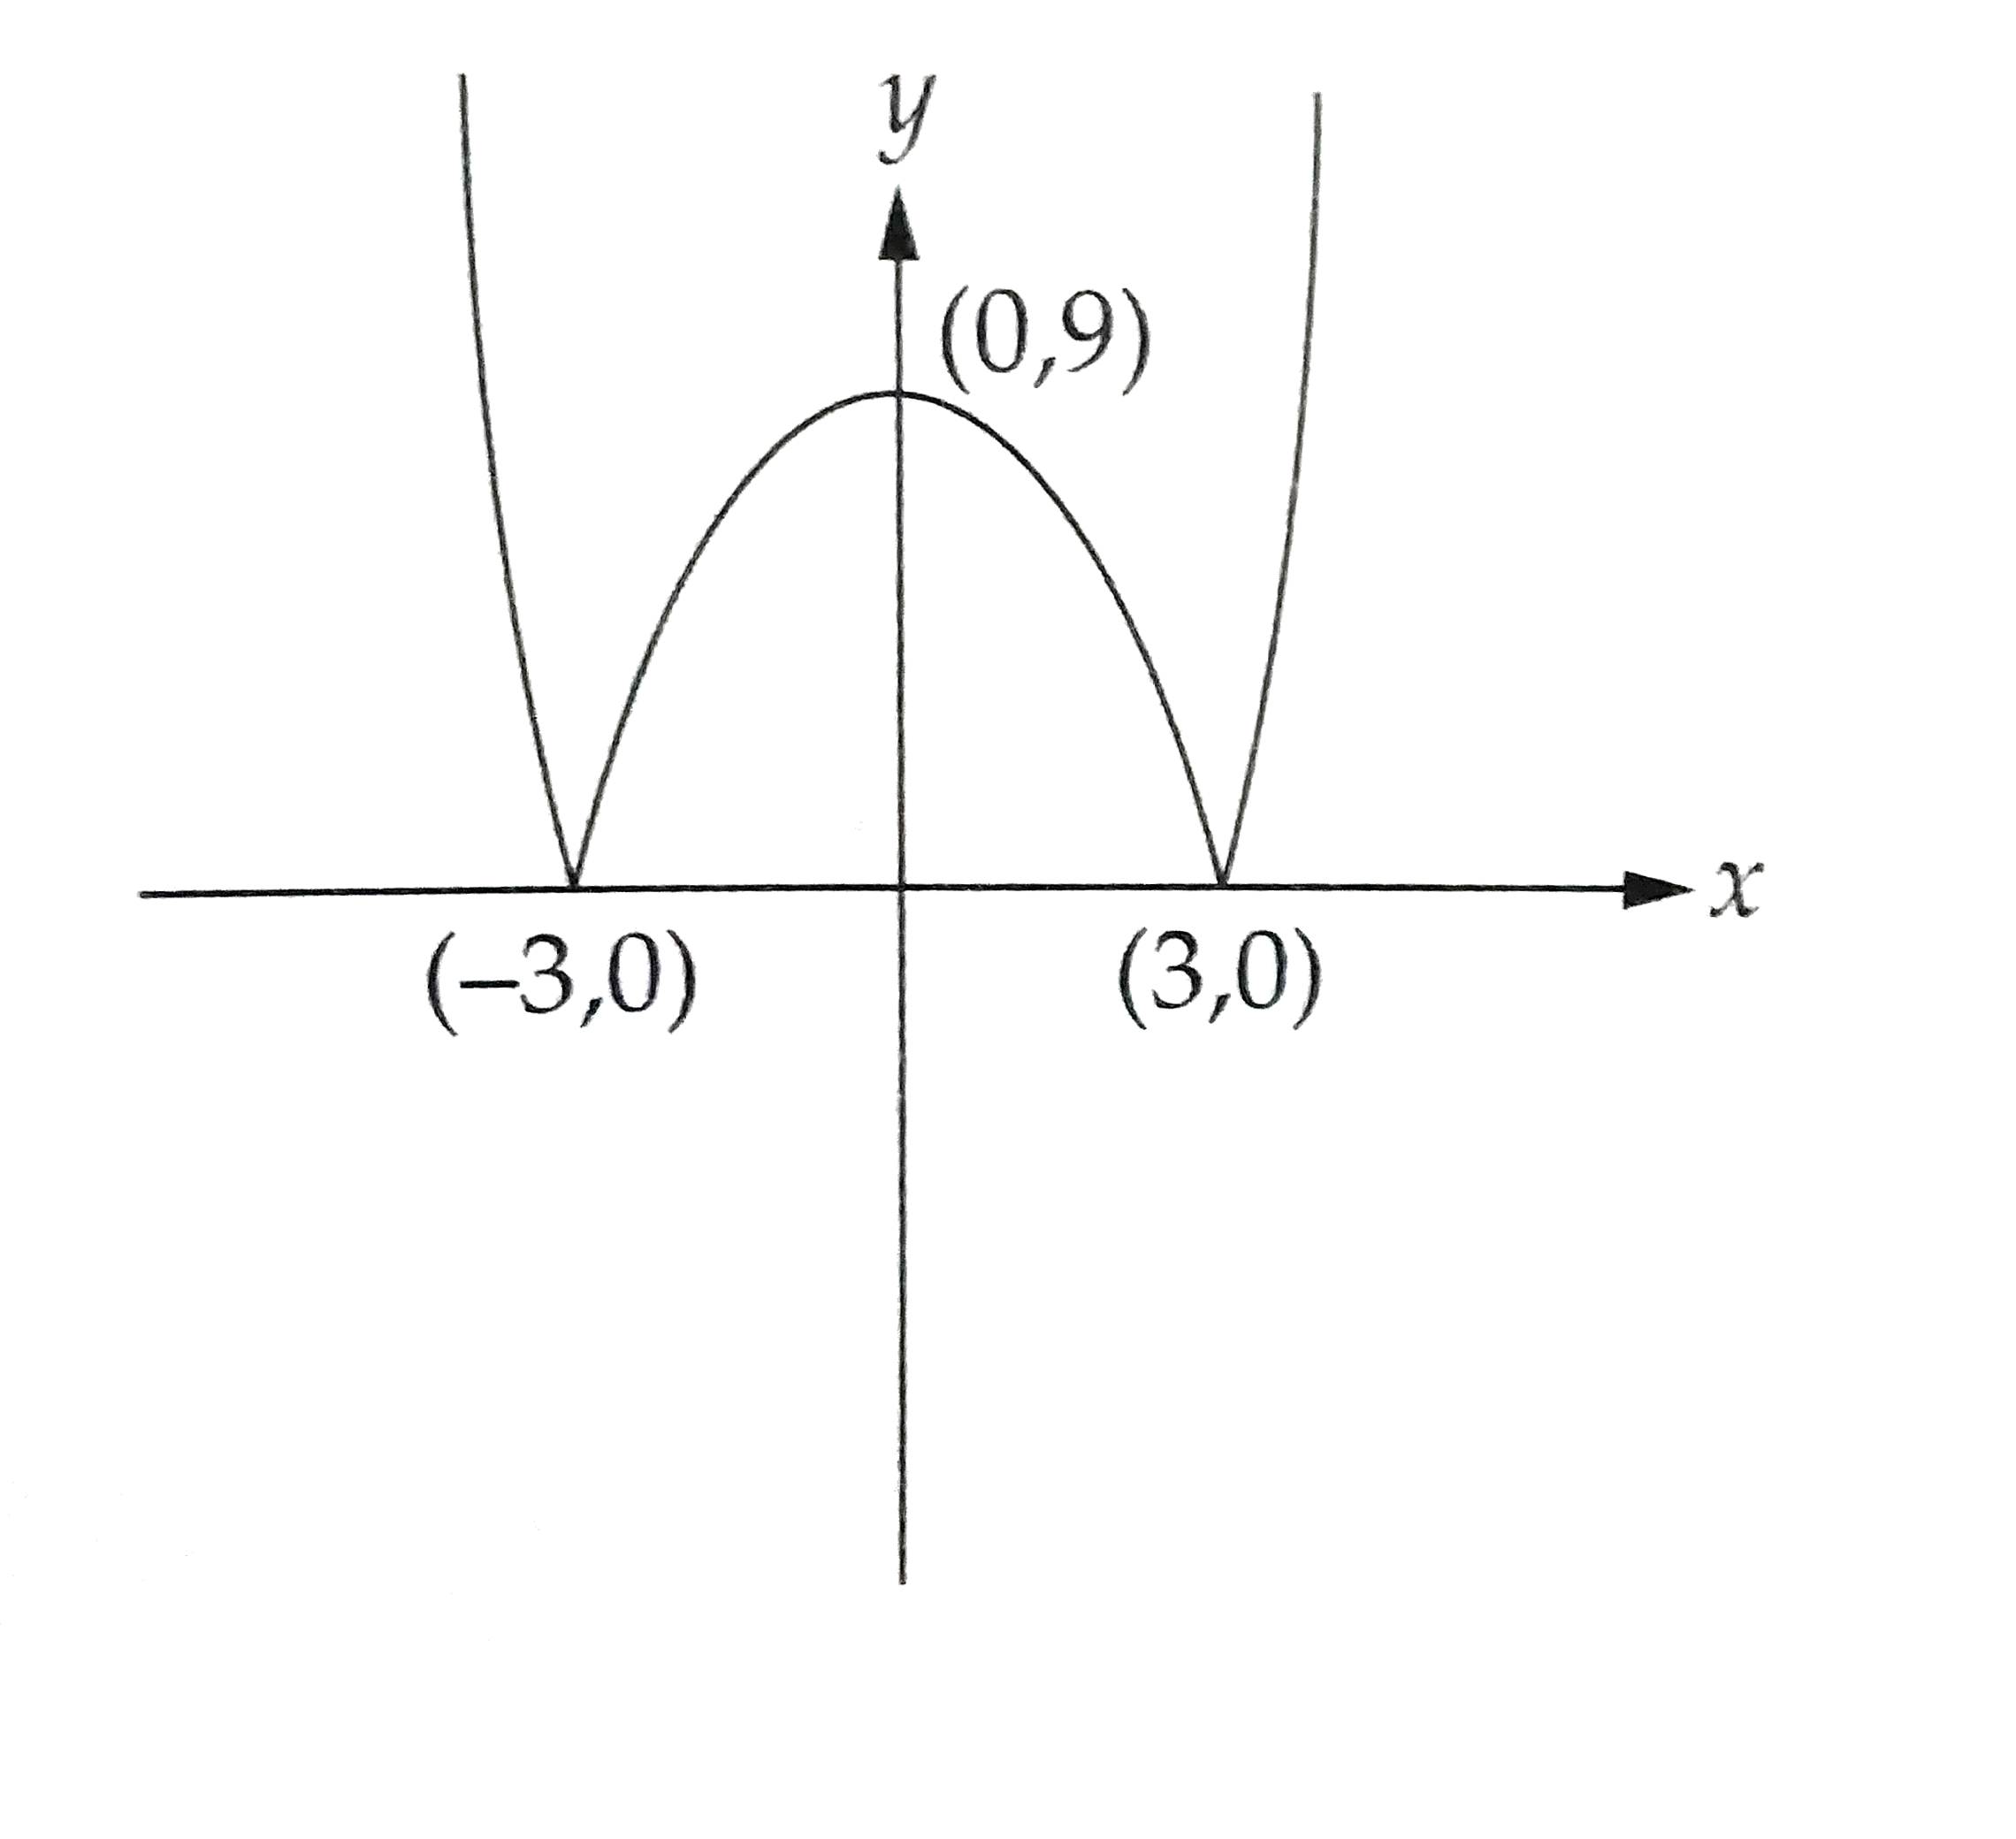
The graph in Figure could be the graph of which of the following functions ?
A
f(x)=x2+9
B
f(x)=(x−9)2
C
f(x)=9−x2
D
f(x)=∣∣−x2+9∣∣
Video Solution
Text Solution
The correct Answer is:D
Testing the point (3, 0) in each of the answer choice, we find that this point is not on the graphs of choices (A), (B), and (D). Therefore, we can eliminate them. Looking at choices (C ) and (D), for any x>3, the graph of (C ) is negative so choice (C ) can be eliminated. Therefore, choice (D) must be correct.
|
Topper's Solved these Questions
- FUNCTIONS BOOK - KAPLANCHAPTER - FUNCTIONS EXERCISE - FUNCTIONS FOLLOW - UP TEST
6 Videos
- EXPONENTS, RADICALS, POLYNOMIALS, AND RATIONAL EXPRESSIONS BOOK - KAPLANCHAPTER - EXPONENTS, RADICALS, POLYNOMIALS, AND RATIONAL EXPRESSIONS EXERCISE - Multiple Choice Question
20 Videos
- FUNCTIONS AND FUNCTION NOTATIONBOOK - KAPLANCHAPTER - FUNCTIONS AND FUNCTION NOTATIONEXERCISE - Multiple Choice Question
20 Videos
Similar Questions
Knowledge Check
The graph of f(x) is shown below :
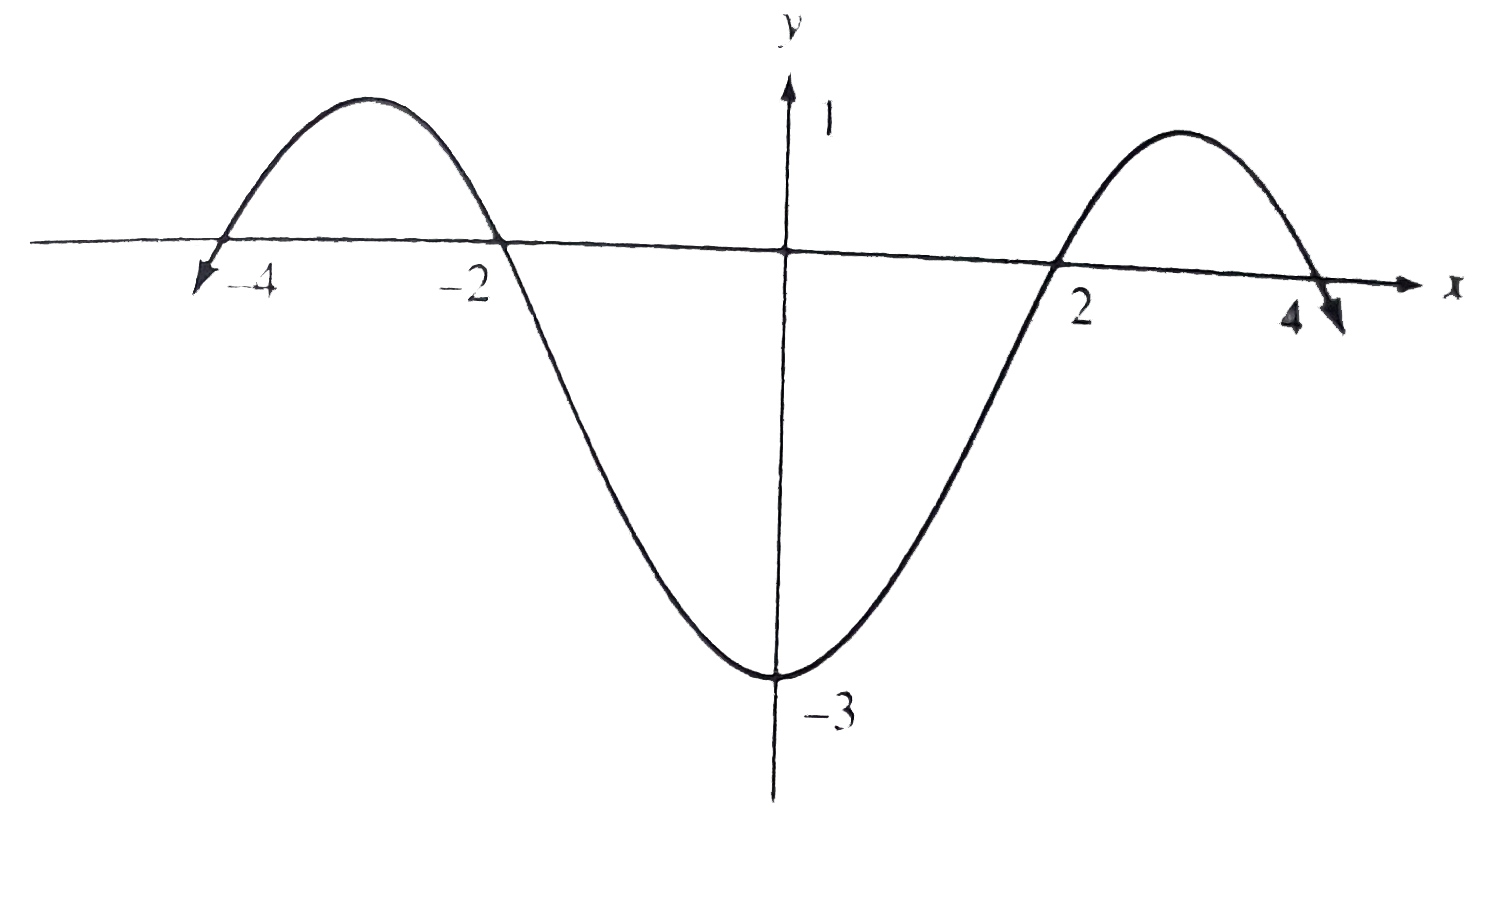
A transformation is applied that results in the following graph :
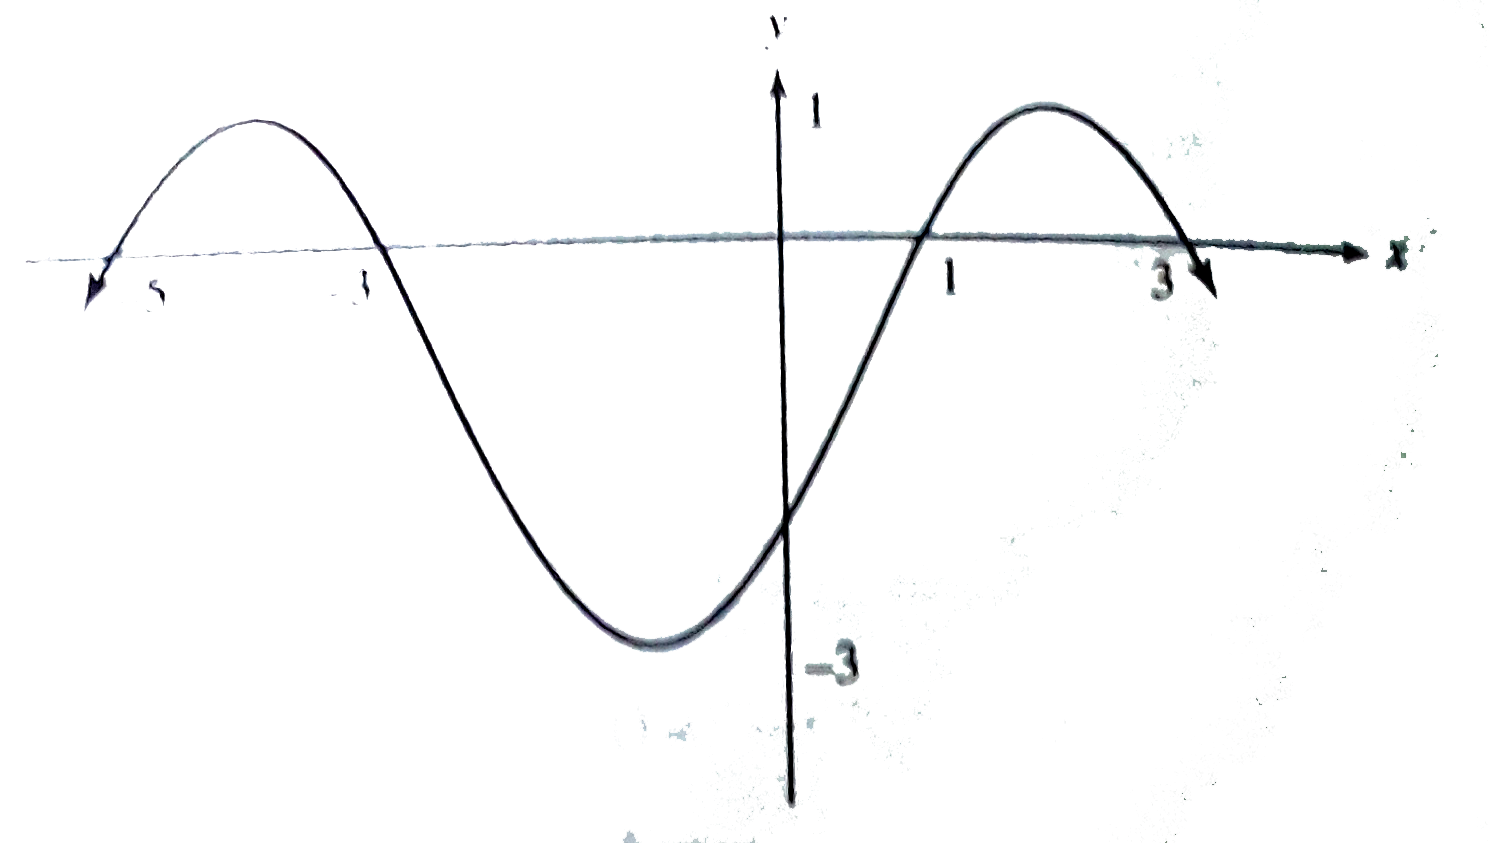
Which of the following functions describes this graph ?Af(x-1)Bf(x+1)Cf(x)-1Df(x)+1The graph in the standard (x,y) coordinate plane below is the graph of one of the following functions, which one?
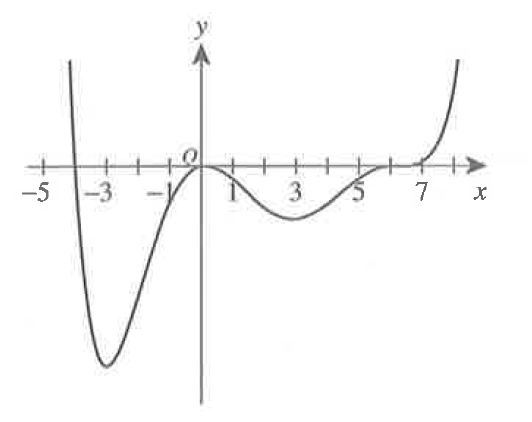 Ag(x)=x(x−6)(x+4)Bh(x)=x2(x+6)(x−4)Cn(x)=x2(x+6)3(x−4)Dp(x)=x2(x−6)3(x+4)
Which of the following graphs is NOT a function ?
A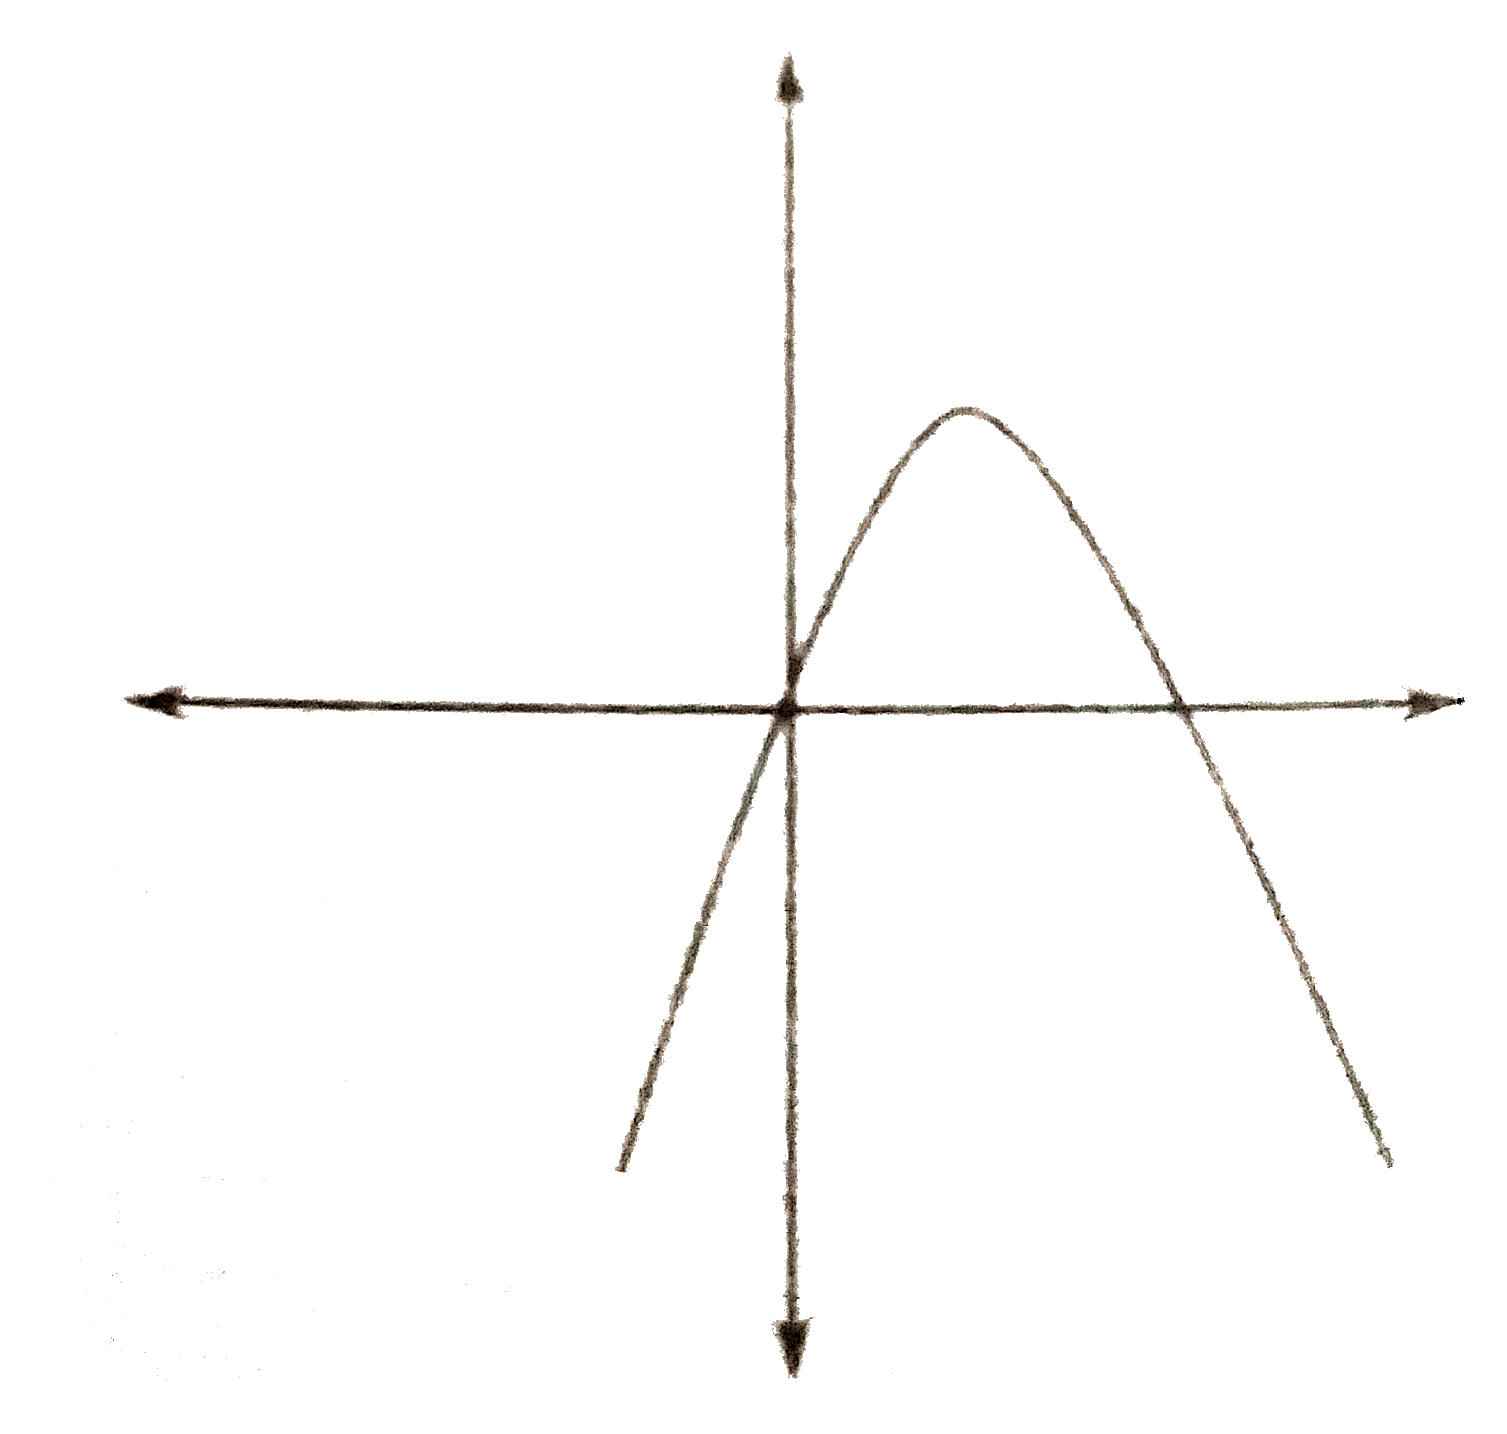 B
B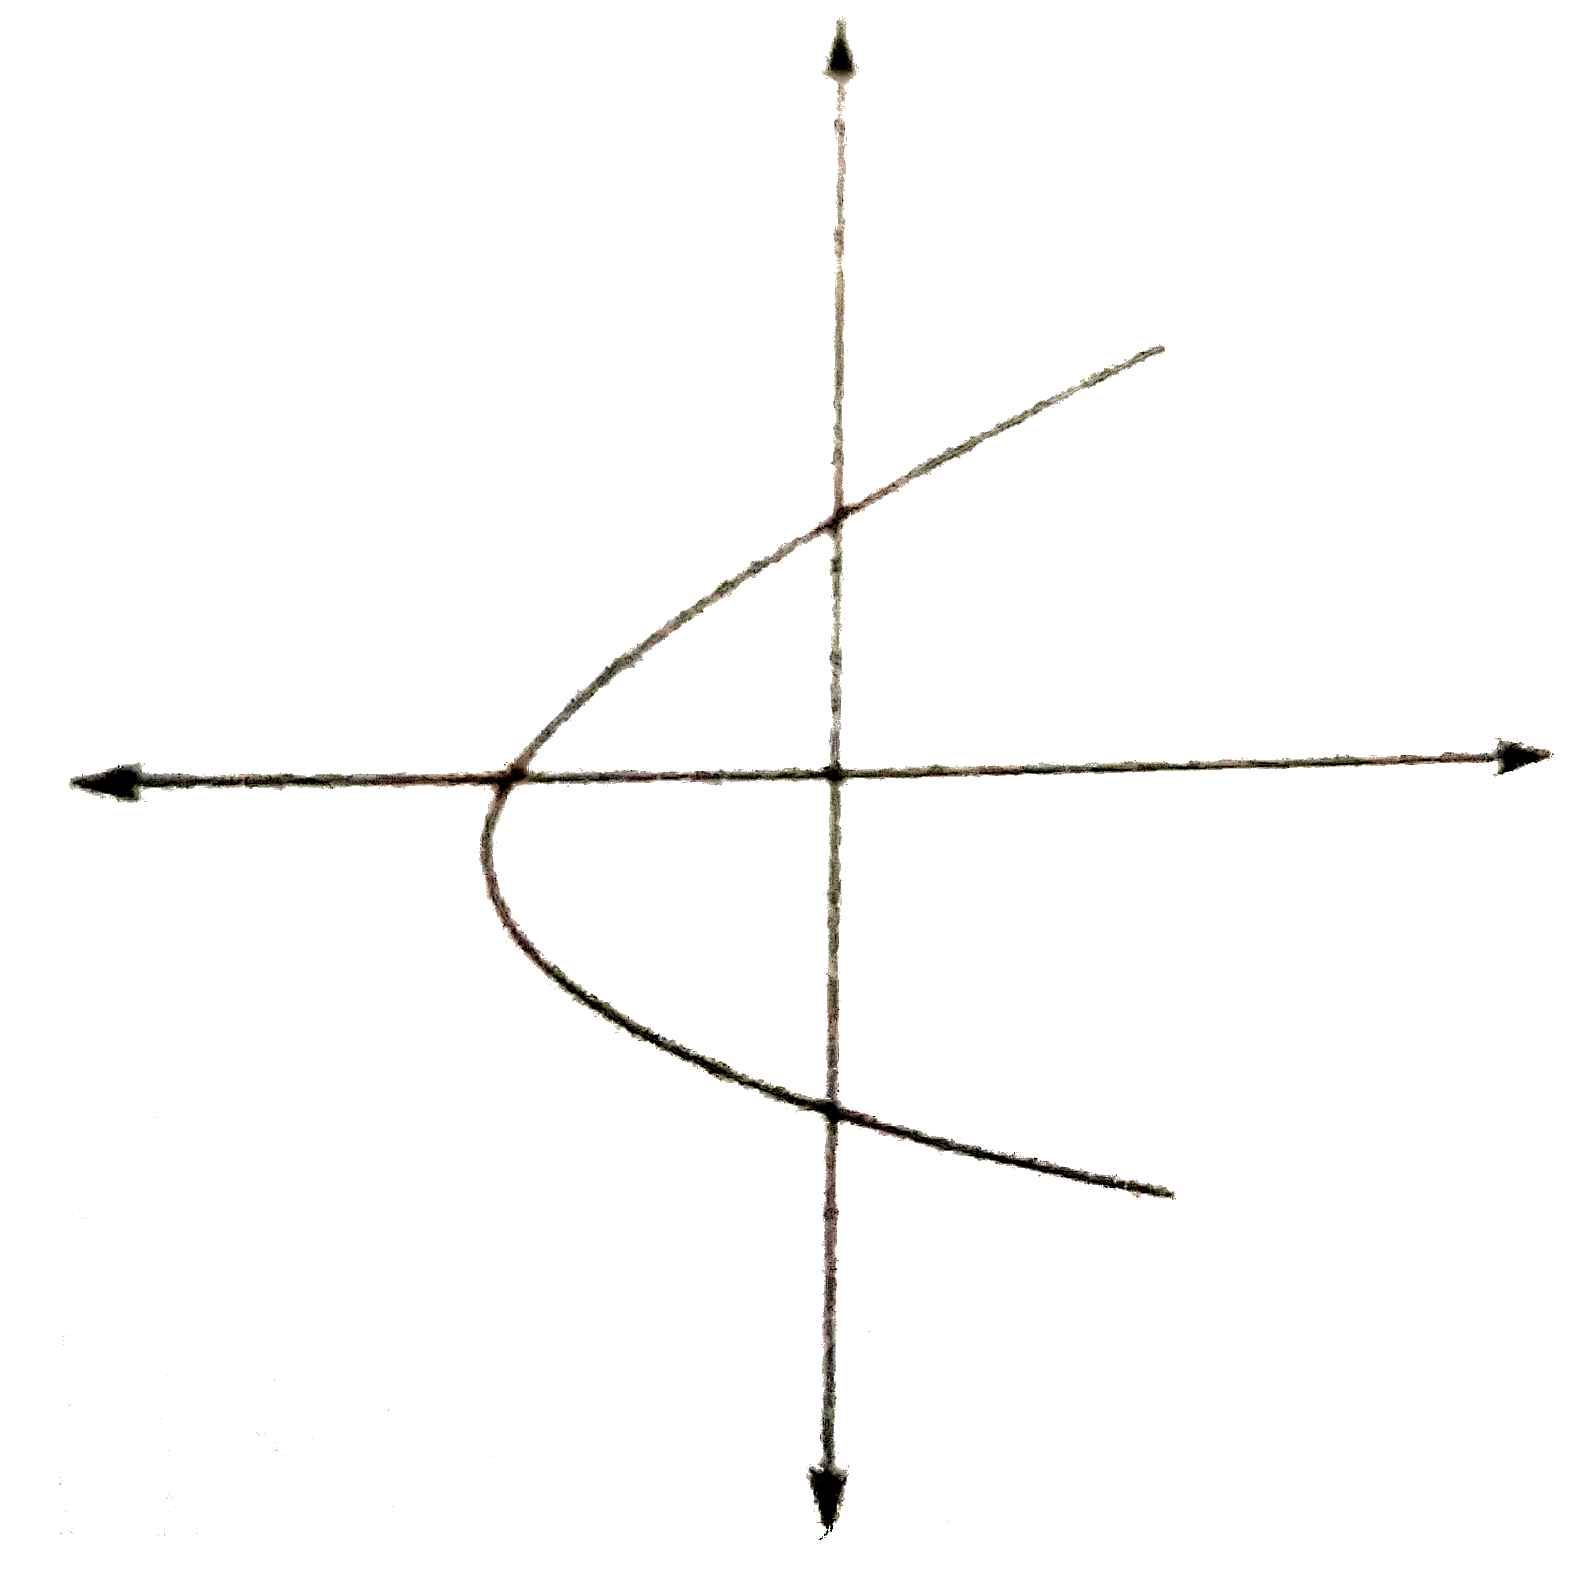 C
C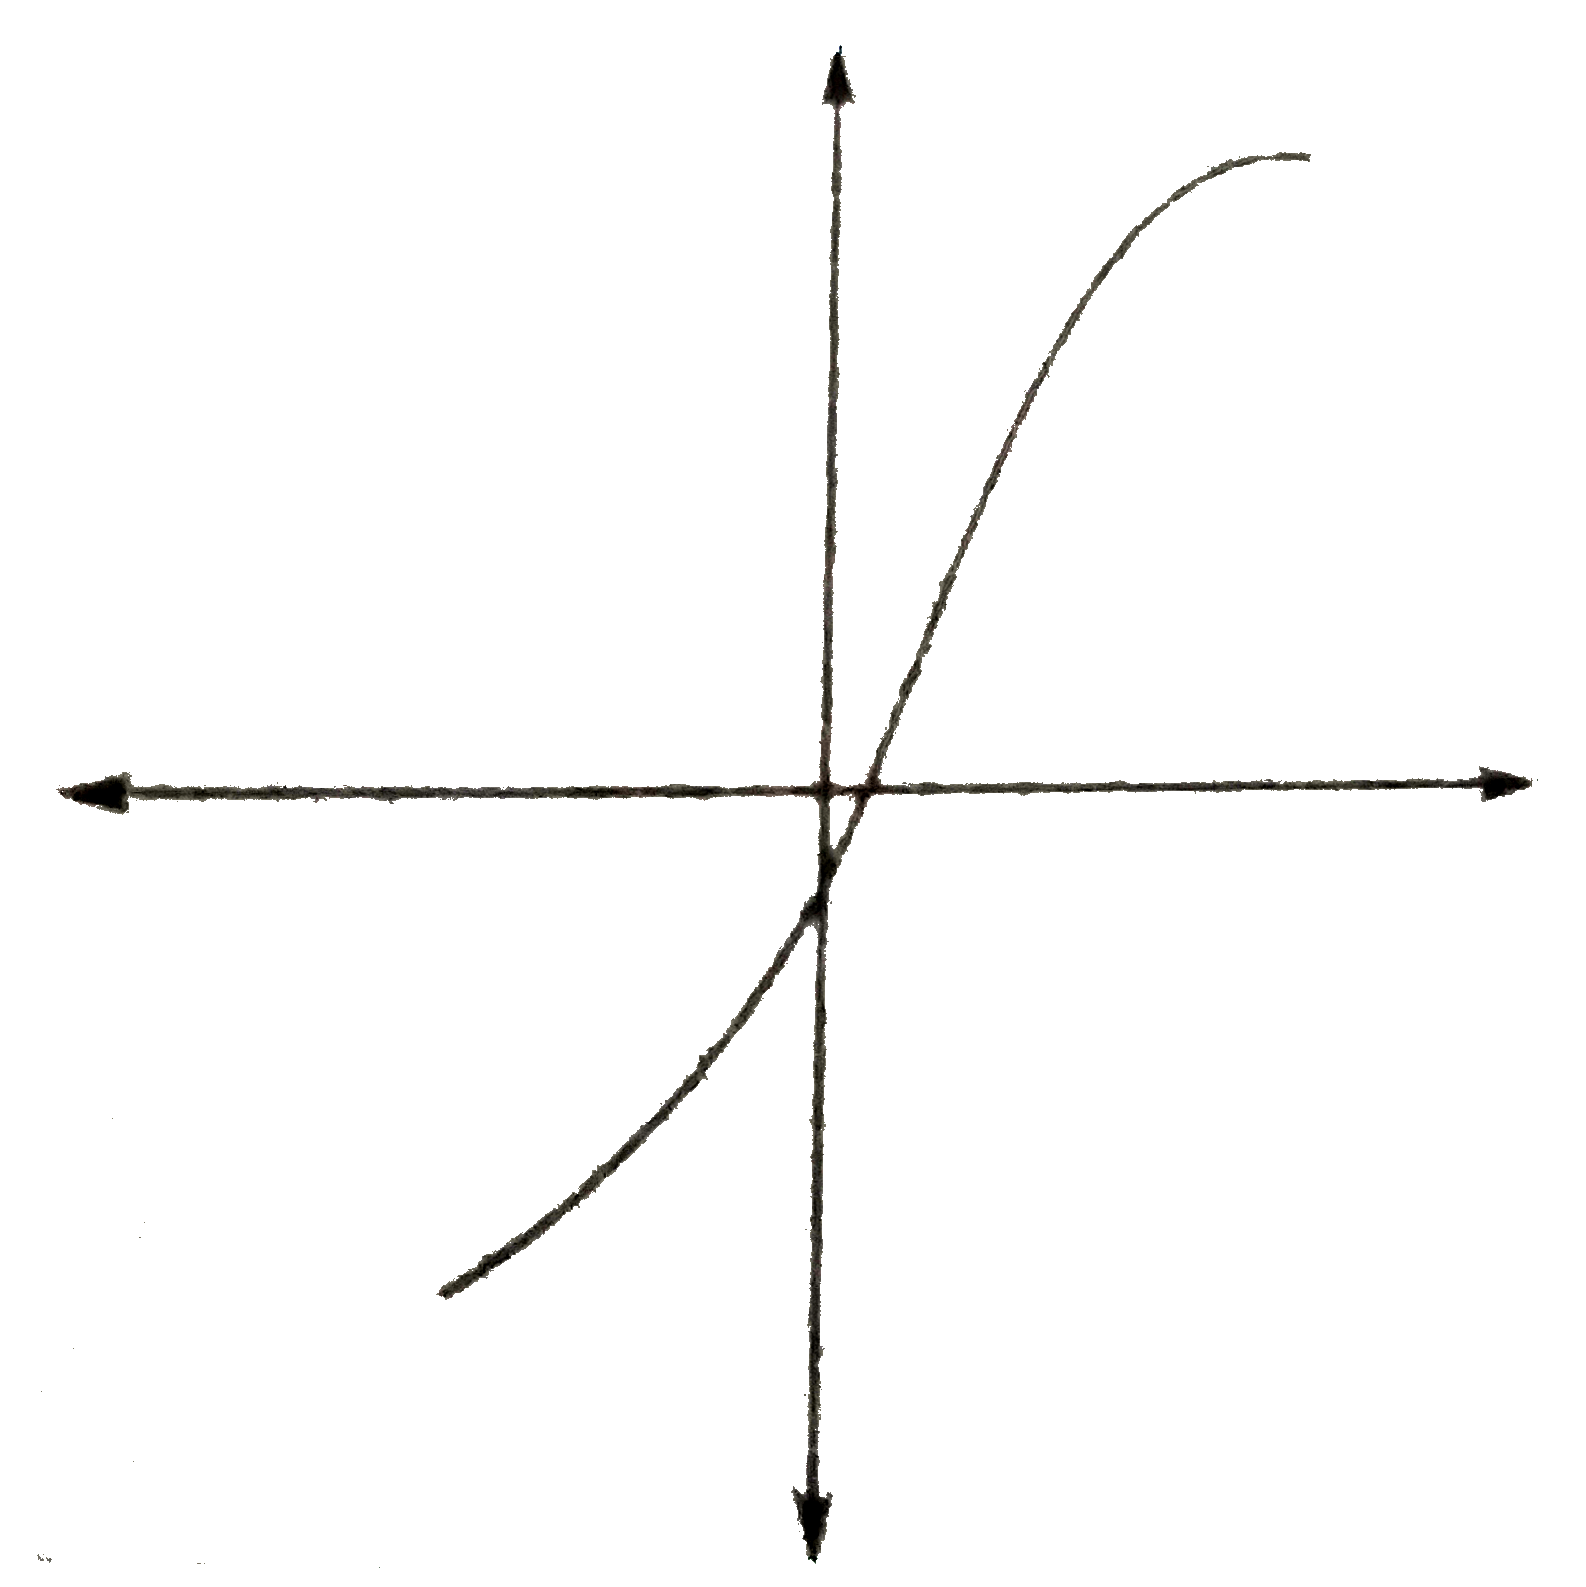 D
D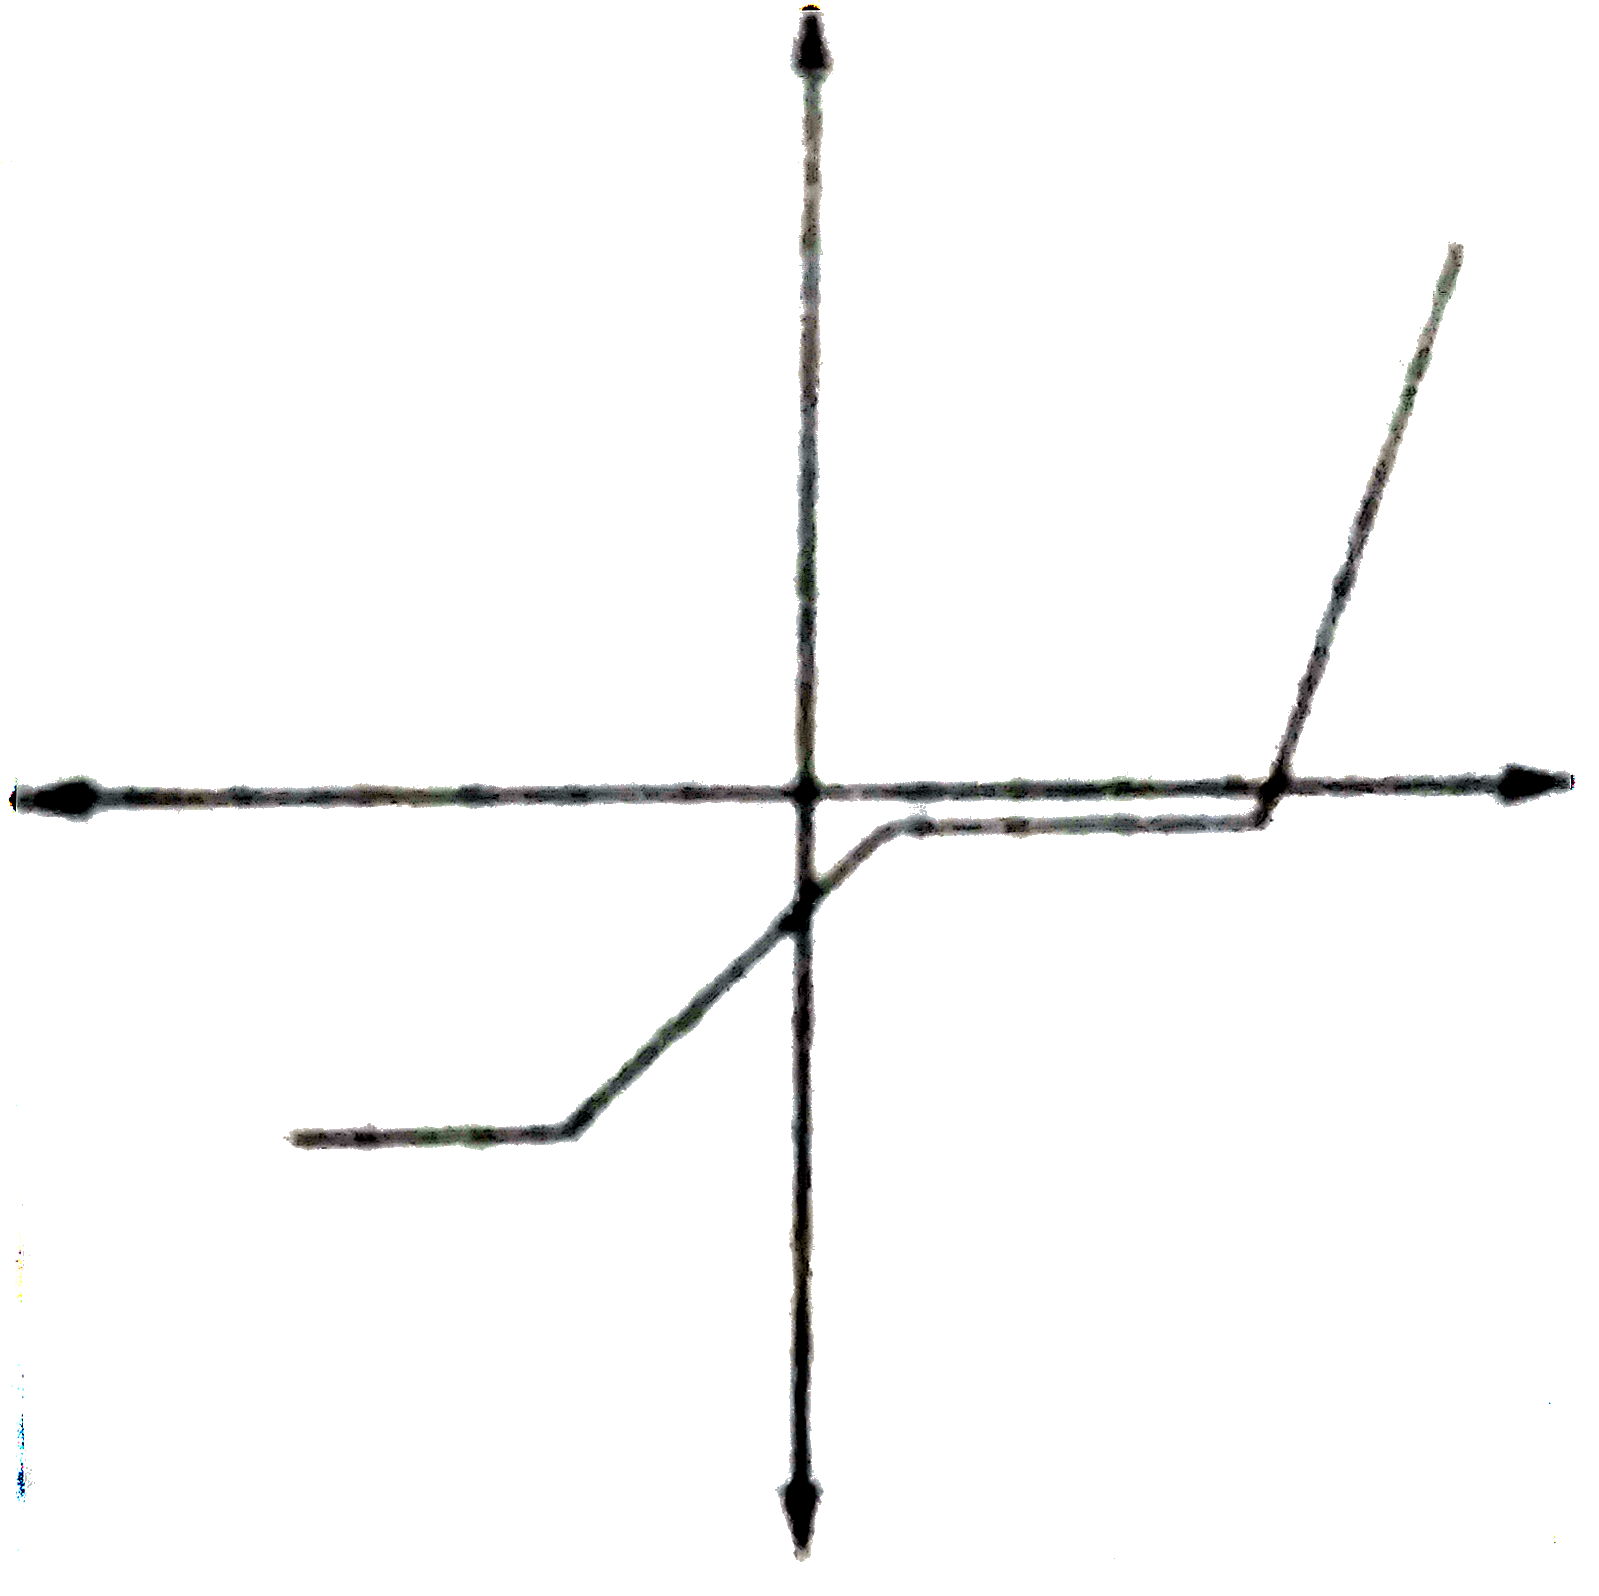
Which of following functions have the same graph?
View SolutionDraw the graph of the following function.
2f(x)
View SolutionDraw the graph of the following function.
−f(x)
View SolutionDraw the graph of the following function.
f(−x)
View Solution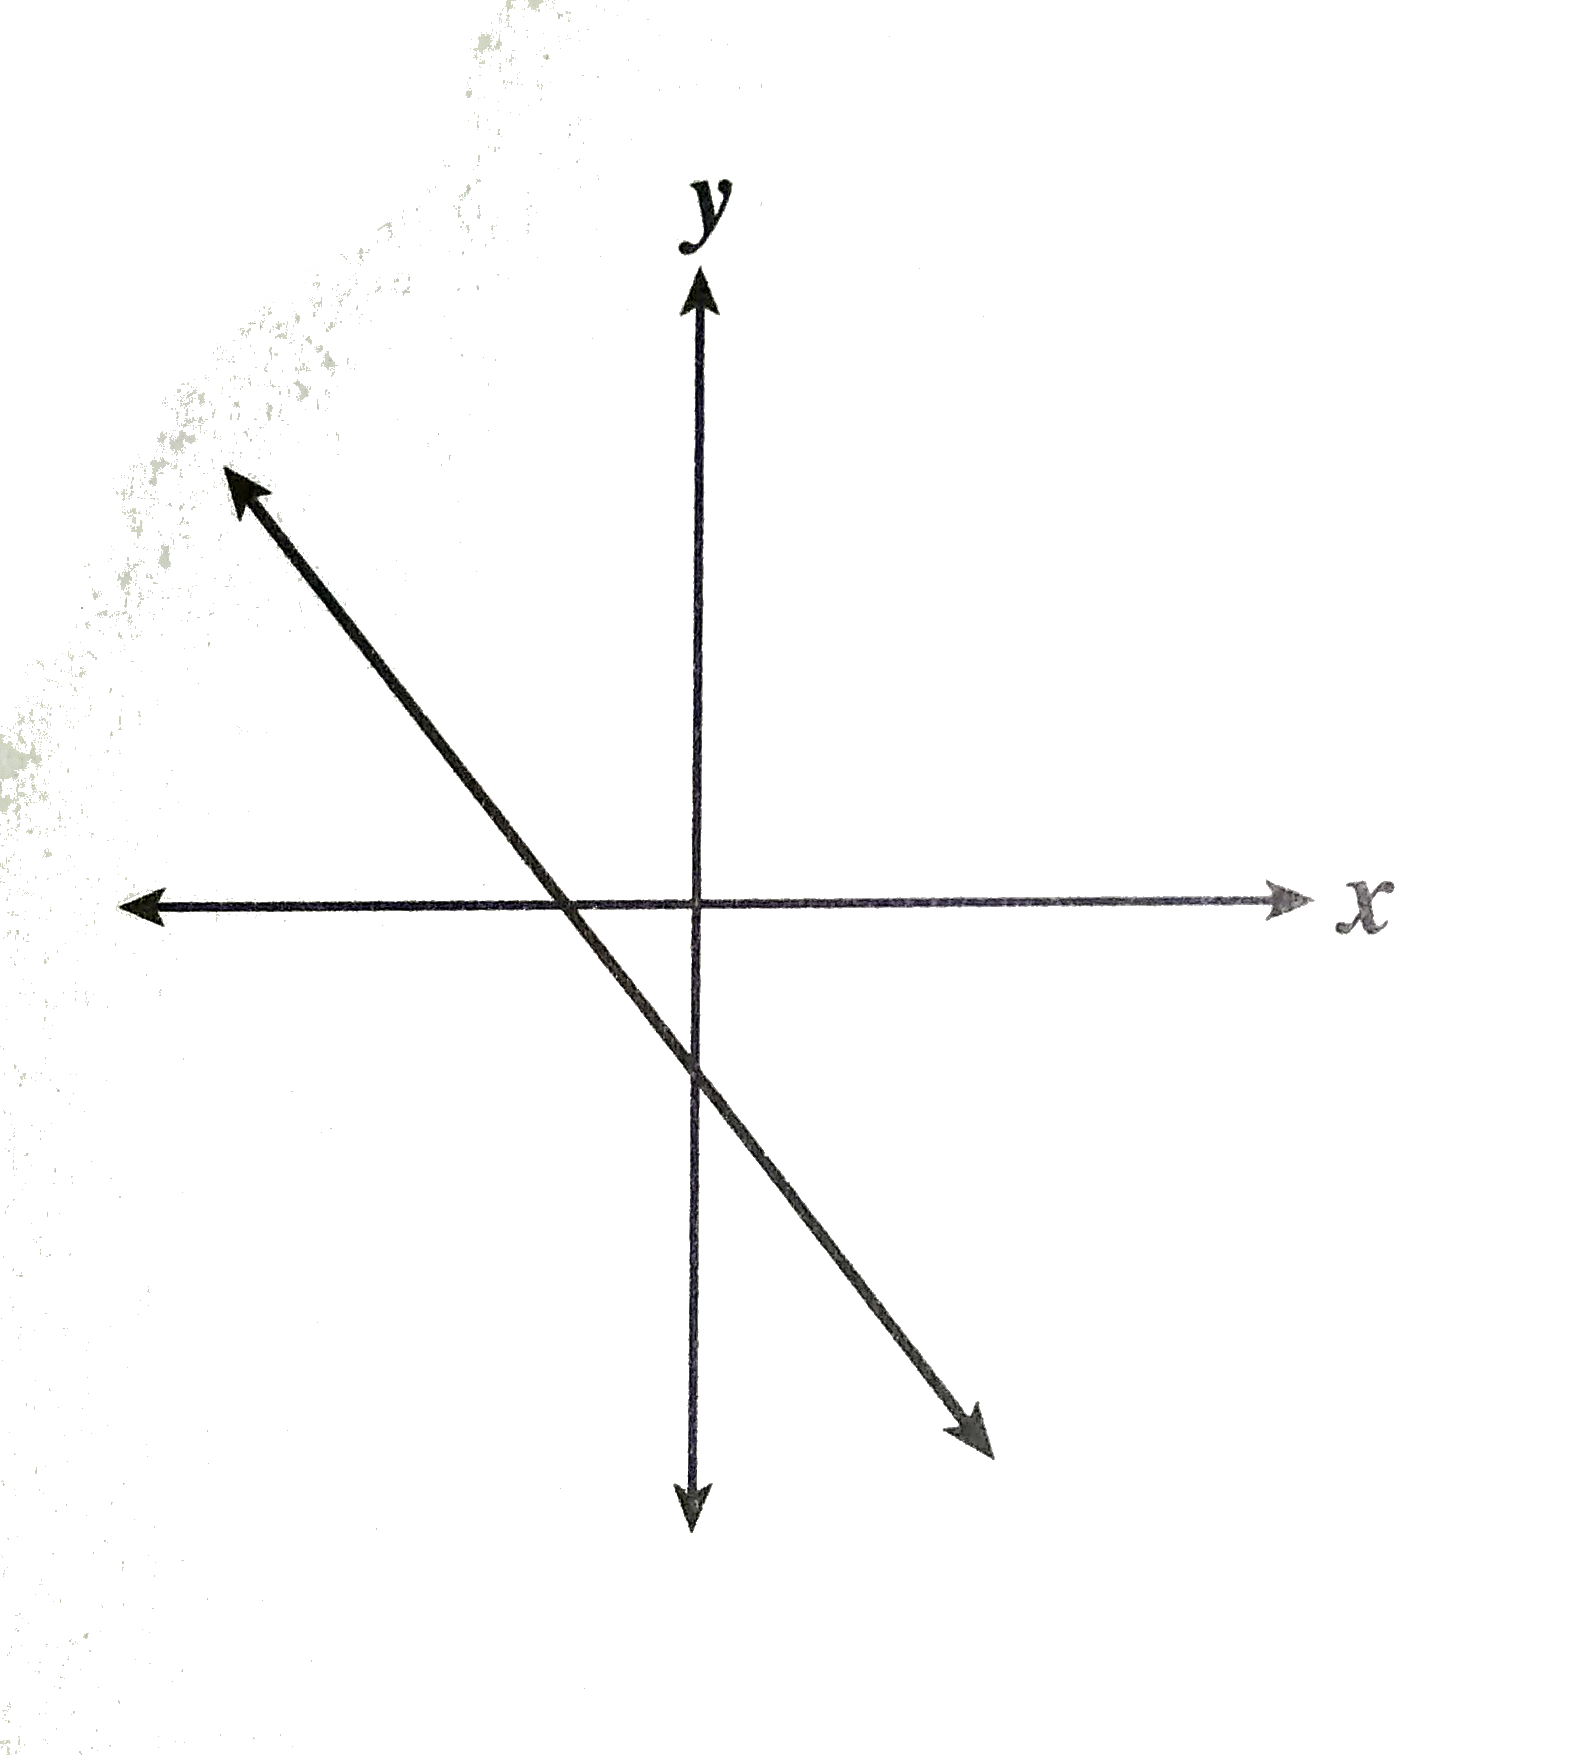
The graph above could represent which of the following equations?
View Solution

