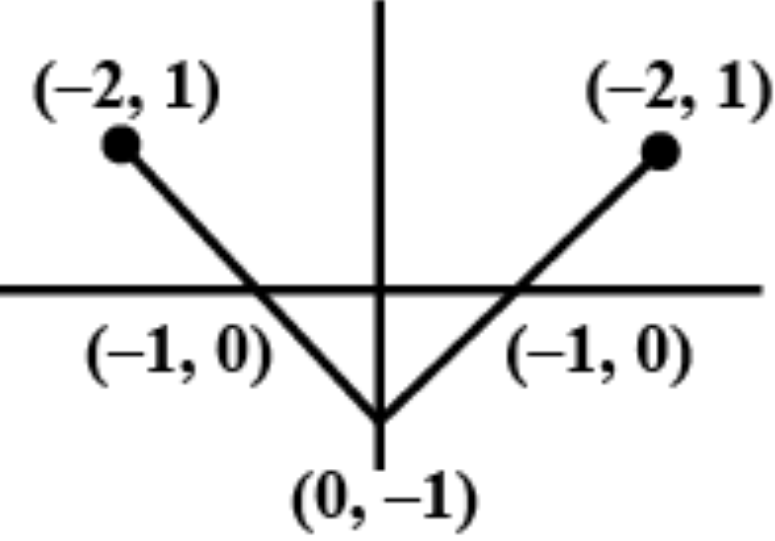
The graph of the curve represented by {x=secθ,y=cosθ} is
a line
A hyperbola
an ellipse
a portion of hyperbola
The correct Answer is:D
To solve the problem, we need to eliminate the parameter θ from the equations x=secθ and y=cosθ to find the relationship between x and y.
1. Start with the given equations:
x=secθandy=cosθ
2. Express secθ in terms of cosθ:
Recall that secθ=1cosθ. Therefore, we can rewrite the equation for x:
x=1y
3. Rearranging the equation:
Multiply both sides by y to eliminate the fraction:
xy=1
4. Identify the type of curve:
The equation xy=1 represents a hyperbola.
5. Determine the restrictions on y:
Since y=cosθ, the range of y is limited to (−1,1). Thus, y cannot take values outside this interval.
6. Conclusion about the graph:
The equation xy=1 describes a hyperbola, but due to the restriction on y (i.e., y can only be between -1 and 1), we are only looking at a portion of the hyperbola that lies within these bounds.
Final Answer:
The graph of the curve represented by x=secθ and y=cosθ is a portion of a hyperbola.
---
x=secθandy=cosθ
Recall that secθ=1cosθ. Therefore, we can rewrite the equation for x:
x=1y
Multiply both sides by y to eliminate the fraction:
xy=1
The equation xy=1 represents a hyperbola.
Since y=cosθ, the range of y is limited to (−1,1). Thus, y cannot take values outside this interval.
The equation xy=1 describes a hyperbola, but due to the restriction on y (i.e., y can only be between -1 and 1), we are only looking at a portion of the hyperbola that lies within these bounds.
The graph of the curve represented by x=secθ and y=cosθ is a portion of a hyperbola.
Topper's Solved these Questions
Similar Questions
Knowledge Check
The area of thee region enclosed by the graph of the polar curve r=1sinθ+cosθ and the x- and y-axis is
A0.48B0.5C0.52D0.98
Solve: tanθ+secθ=2cosθ
View SolutionThe graph of the function y=f(x). Then which of the following curve represent the graph of the function y=|f(x)|

View SolutionFind the slopes of the tangent and the normal to the curve x=a(θ−sinθ) , y=a(1+cosθ) at θ=−π/2
View SolutionFind the slopes of the tangent and the normal to the curve x=a(θ−sinθ), y=a(1−cosθ) at θ=π/2
View SolutionFind the equations of the tangent and the normal to the curve x=a(θ+sinθ), y=a(1−cosθ) at θ at indicated points.
View SolutionFind the equations of the tangent and the normal to the curve x=θ+sinθ , y=1+cosθ at θ=π/2 at indicated points.
View SolutionFind the equation of the tangent to the curve x=θ+sinθ , y=1+cosθ at θ=π/4 .
View Solution
