The histogram shows the number of students using different modes of transport to commute from residence to school.
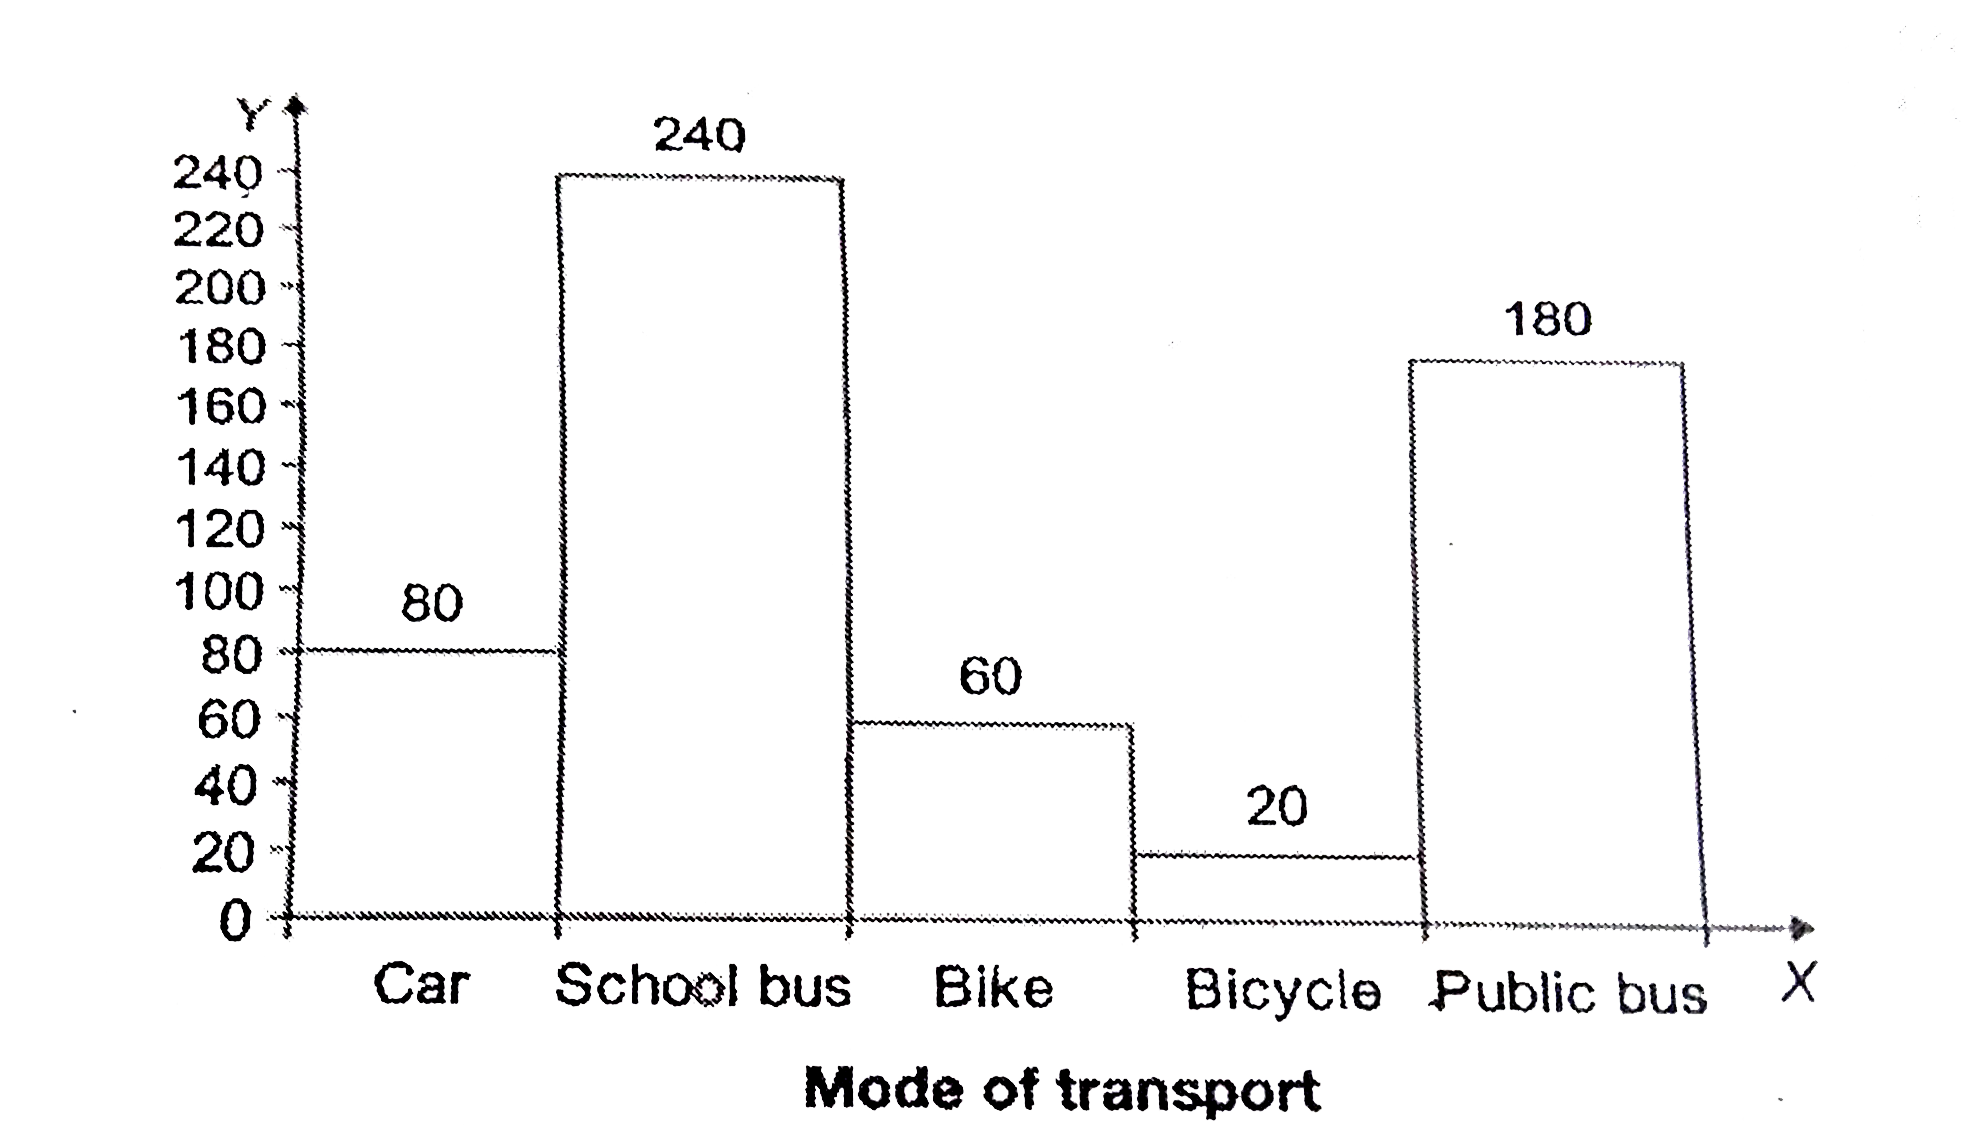
From the bar graph, answer the following question :
What is the total number of pupils who travel by school bus and bike ?
200
320
300
100
The correct Answer is:C
The number of pupils who travel by school bus and by bike =240+60=300.
Hence, the correct option is (c ).
Topper's Solved these Questions
- BOOK - PEARSON IIT JEE FOUNDATIONCHAPTER - STATISTICSEXERCISE - SHORT ANSWER TYPE QUESTION9videos
STATISTICS
- BOOK - PEARSON IIT JEE FOUNDATIONCHAPTER - STATISTICSEXERCISE - CONCEPT APPLICATION5videos
STATISTICS
- BOOK - PEARSON IIT JEE FOUNDATIONCHAPTER - STATISTICSEXERCISE - EXAMPLE 10.61videos
STATISTICS
- BOOK - PEARSON IIT JEE FOUNDATIONCHAPTER - SETSEXERCISE - Crossword1videos
SETS
Similar Questions
Read the bar graph carefully and answer the following questions.
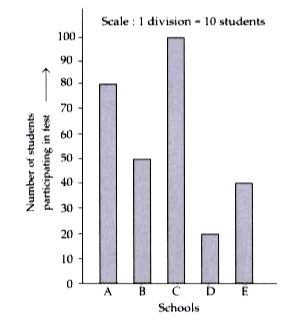 What is the difference between the numbr of students participated from school C and D ?View Solution
70 students from a locality use different modes of transport to go to school as given below:
 Draw the bar graph representing the above data.View Solution
Knowledge Check
- Question 1 - Select One
The histogram shows the number of students using different modes of transport to commute from residence to school.

From the bar graph, answer the following question :
The ratio of the number of pupits who travel by school bus who travel by public bus is __________ .A3:4B1:1C4:3D1:2 - Question 2 - Select One
The histogram shows the number of students using different modes of transport to commute from residence to school.
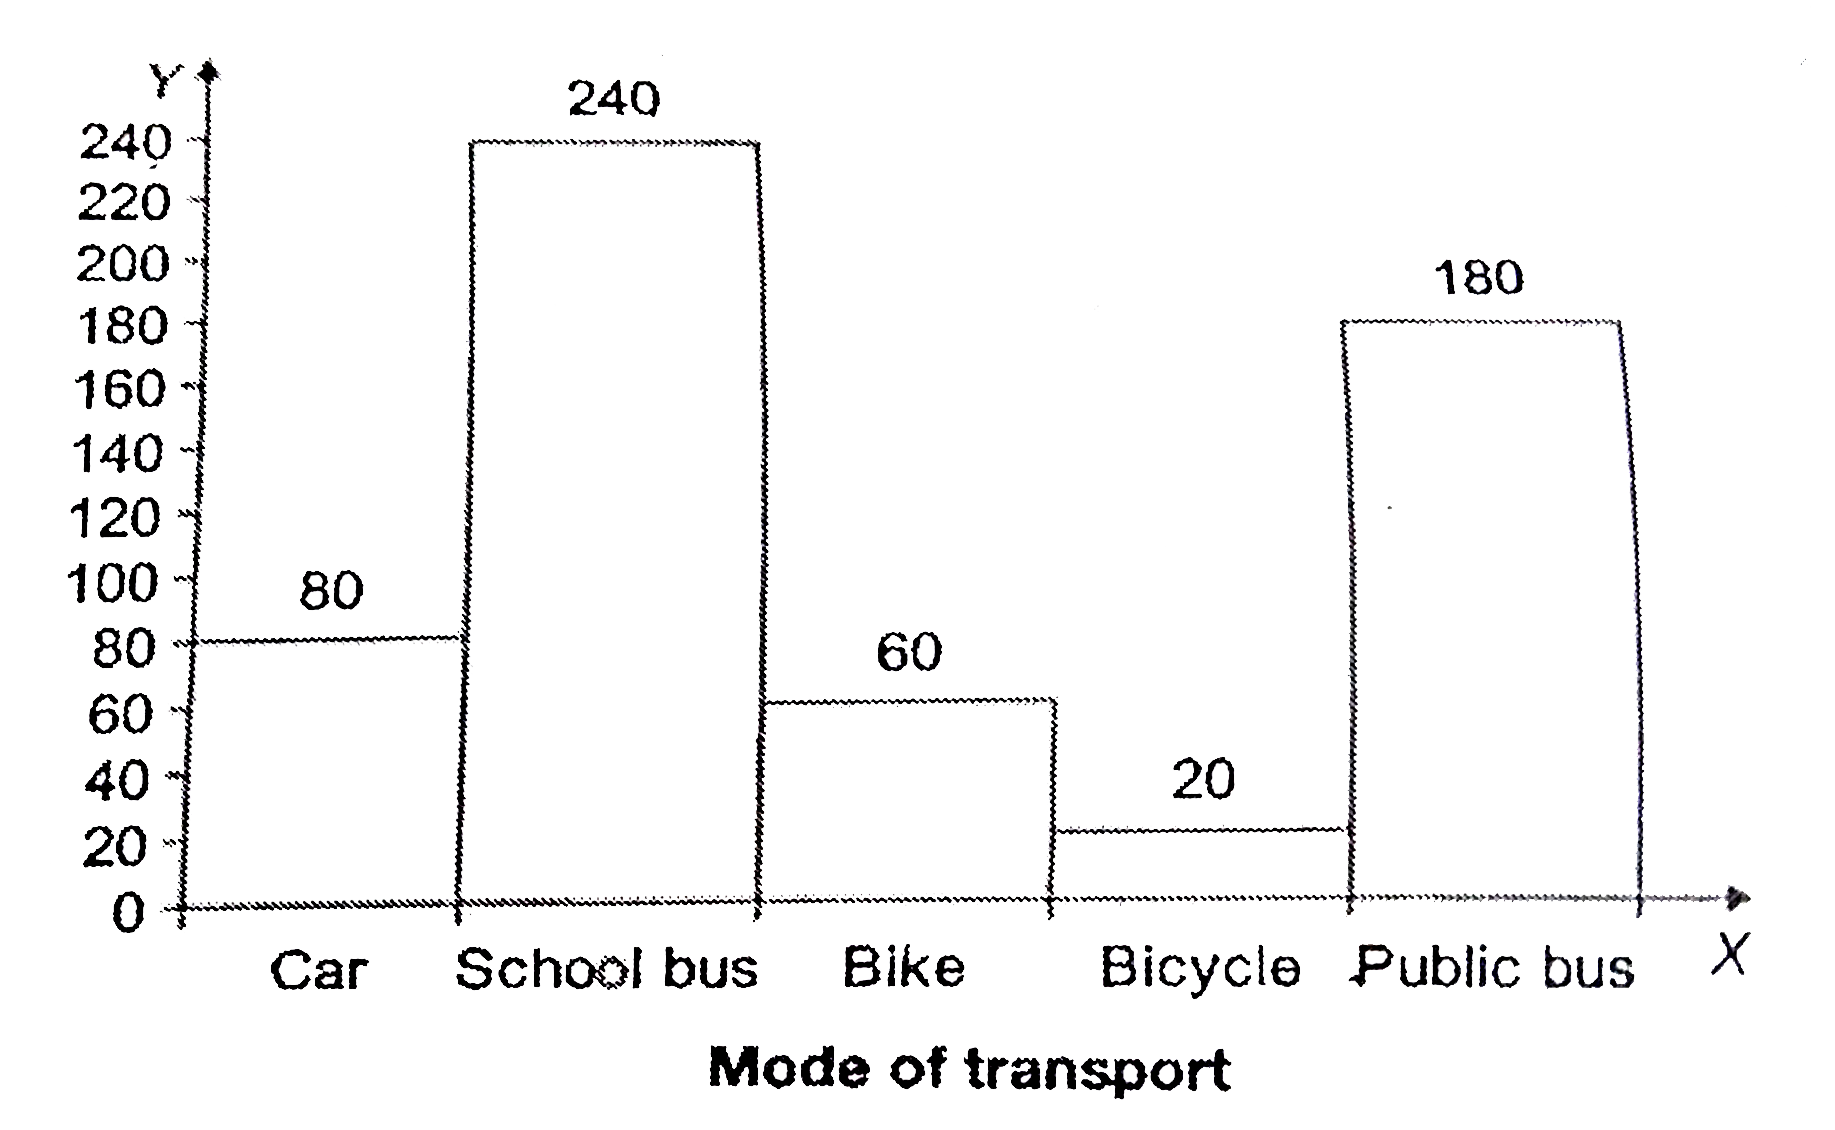
From the bar graph, answer the following question :
The number of pupils who travel by bike is 3 times than that of the number of pupils who travel by ________ .ABicycleBPublic busCCarDSchool bus - Question 3 - Select One
The histogram shows the number of students using different modes of transport to commute from residence to school.
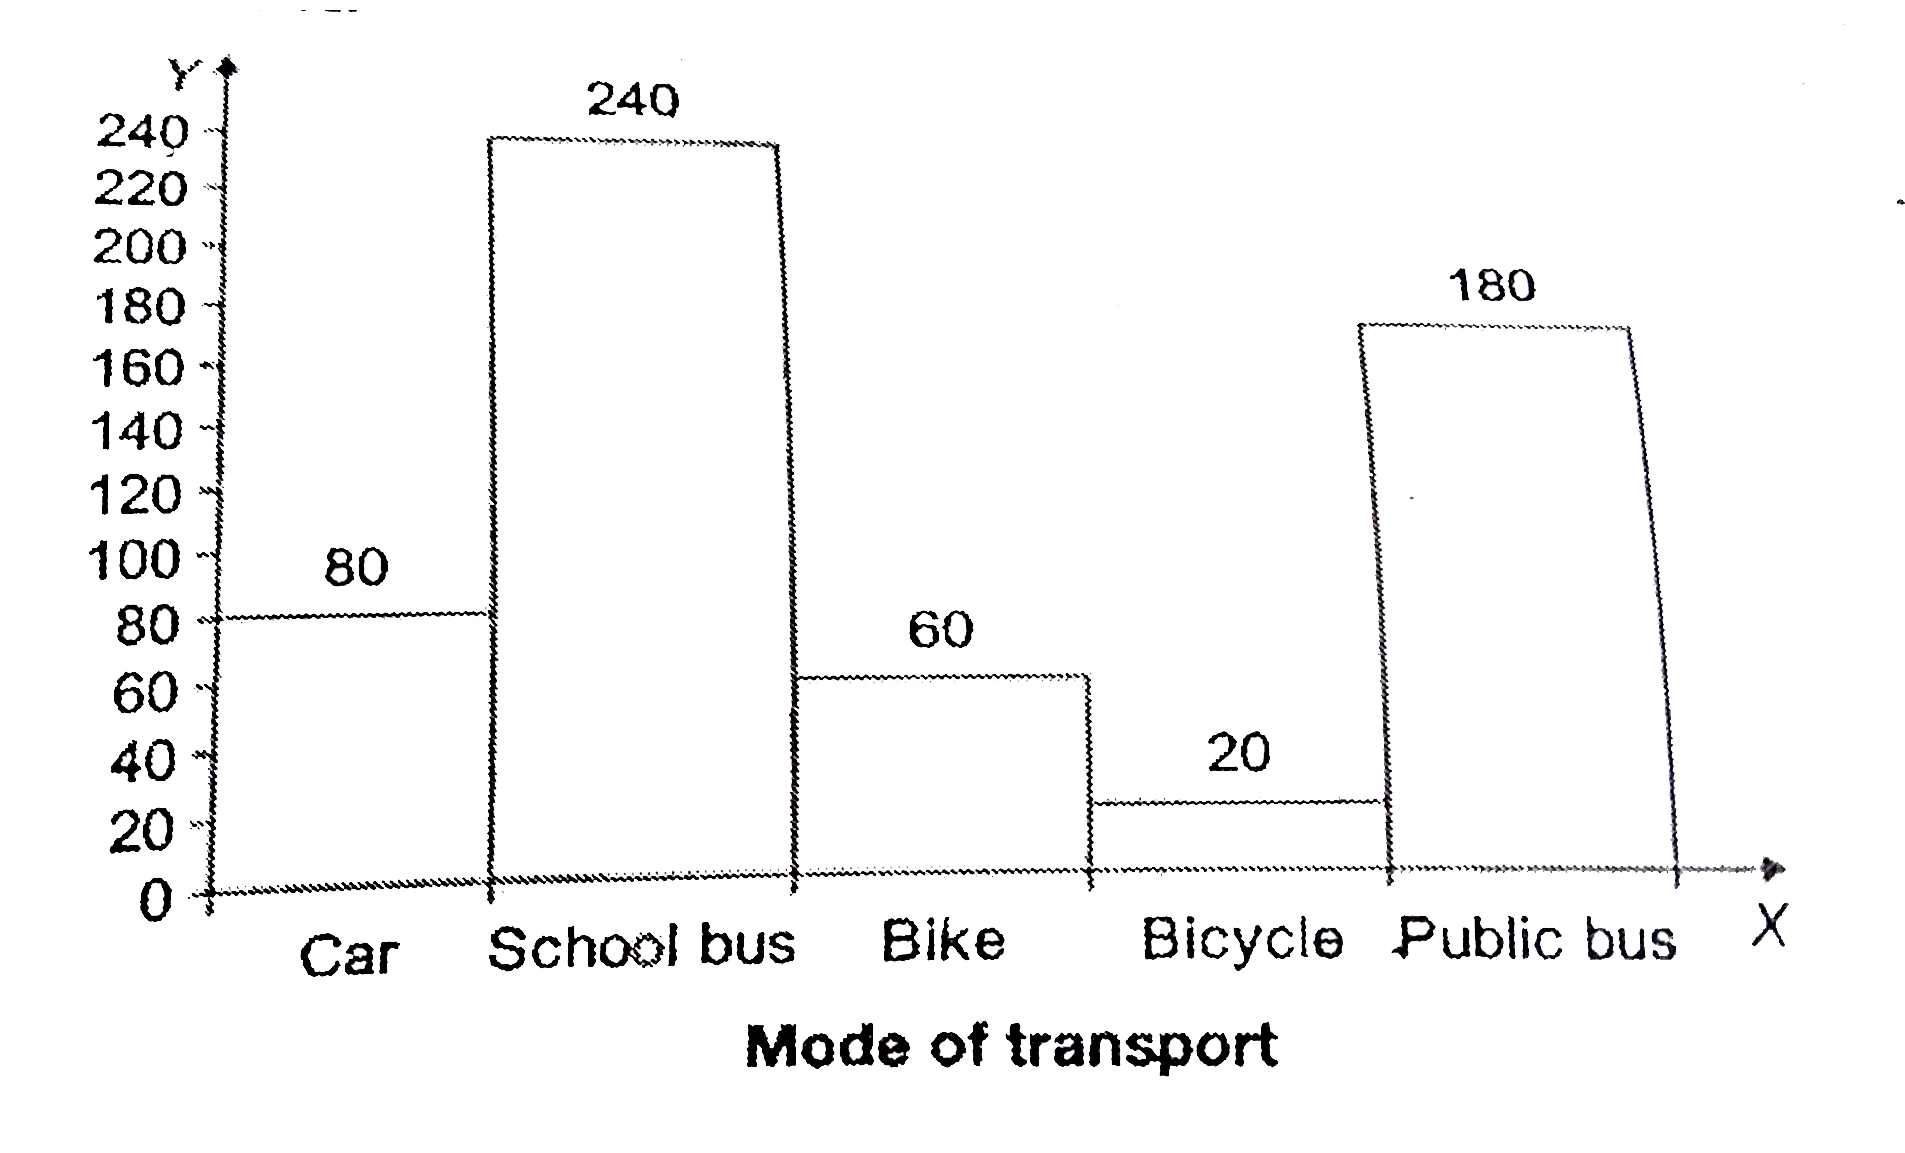
From the bar graph, answer the following question :
How many more pupils travel by public bus than by carA100B120C160D220
70 students from a locality use different modes of transport to go to school as given below:

Draw the bar graph representing the above data.View SolutionThe following bar graph represents the data for different sizes of shoes worn by the students in a school. Read the graph and answer the following questions.
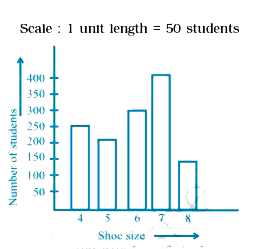
What is the number of students wearing shoe size 6?View SolutionIn the given bar graph, what is the average number of girls from all school
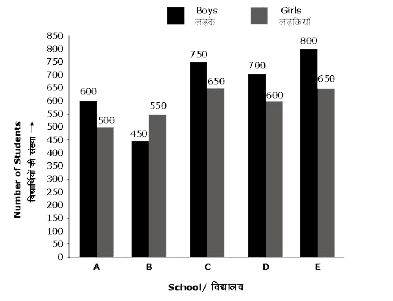 View Solution
The pie-chart given below shows the number of students enrolled in a school in different activities. Total number of students in the school is 1200. Study the chart and answer the questions.
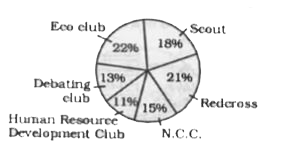
What is the total number of students enrolled in Debating Club and HRD Club ?View SolutionThe histogram shows the number of students using different modes of transport to commute from residence to school.
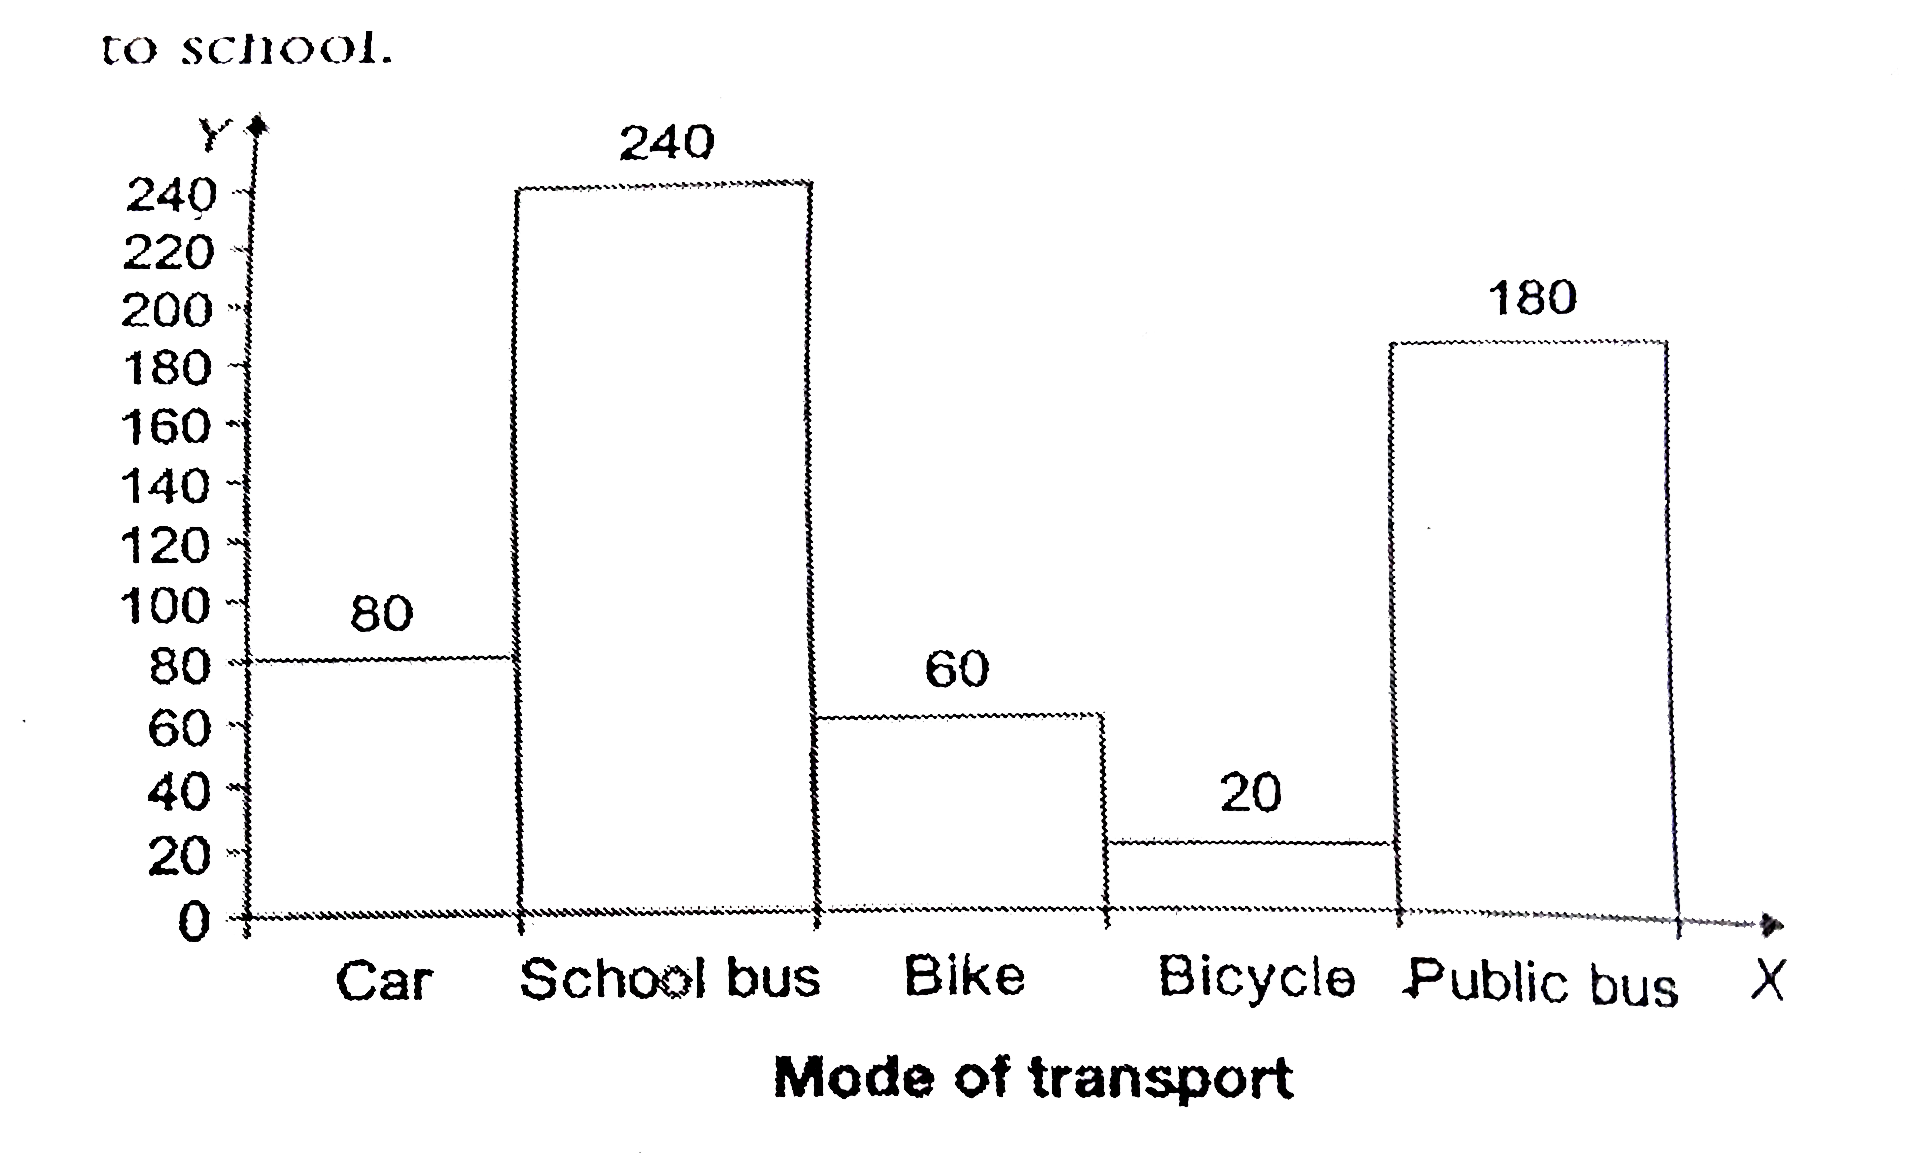
From the bar graph, answer the following question :
If 6 girls travel to school by bicycle, then how many boys travel by bicycle ?View Solution

