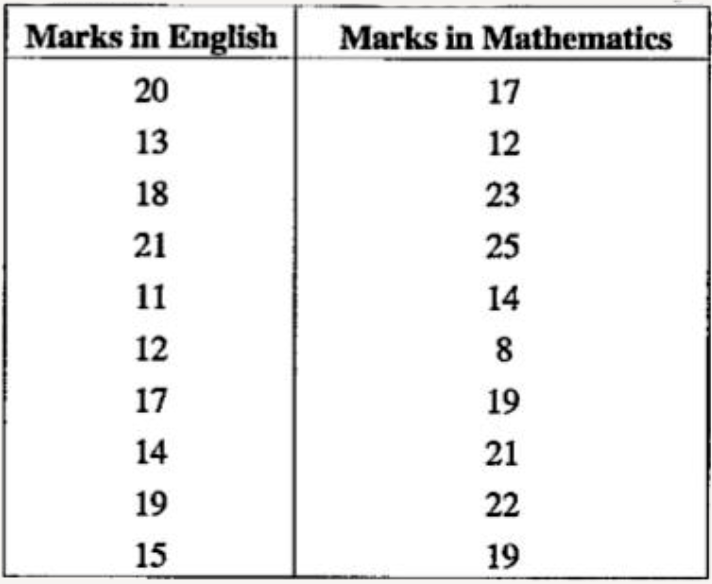
The marks obtained by 10 candidates in English and Mathematics are given below:

Estimate the probable score for Mathematics if the marks obtained in English are 24.
Step by step video & image solution for The marks obtained by 10 candidates in English and Mathematics are given below: Estimate the probable score for Mathematics if the marks obtained in English are 24. by Maths experts to help you in doubts & scoring excellent marks in Class 12 exams.
Updated on:21/07/2023Topper's Solved these Questions
- MATHEMATICS-2016BOOK - ICSECHAPTER - MATHEMATICS-2016EXERCISE - SECTION-B
6 Videos
- MATHEMATICS-2016BOOK - ICSECHAPTER - MATHEMATICS-2016EXERCISE - SECTION-C
6 Videos
- MATHEMATICS-2015BOOK - ICSECHAPTER - MATHEMATICS-2015EXERCISE - SECTION-C
5 Videos
- MATHEMATICS-2020BOOK - ICSECHAPTER - MATHEMATICS-2020EXERCISE - SECTION C
8 Videos
Similar Questions
Following table shows the marks obtained by 8 students in English and Mathematics.

A candidate scored 85 marks in Y but was absent from the X test. Estimate his probable score for other test.
View SolutionUse graph paper for this question.
The amrks obtained by 120 students in an English test are given below :


Draw the ogive and hence, estimate :
the upper quartile marks.
View SolutionUse graph paper for this question.
The amrks obtained by 120 students in an English test are given below :


Draw the ogive and hence, estimate :
the number of students who did not pass test if the pass percetage was 50.
View SolutionThe marks obtained by 120 students in a Mathematics test are given below:

Using the informations, given above, draw an ogive on a graph sheet. Take a suitable scale for your ogive. Use the ogive drawn to estimate :
(i) the median.
(ii) the number of students who obtained more than 75% marks in the test.
(iii) the number of students who did not pass in the test if the pass percentage was 40.
View SolutionThe marks obtained by 100 students in a Mathematics test are given below :

Draw an ogive for the given distribution on a graph sheet.
(Use a scale of 2 cm = 10 units on both axis).
Use the ogive to estimate the :
(ii) lower quartile.
View SolutionThe marks obtained by 100 students in a Mathematics test are given below :

Draw an ogive for the given distribution on a graph sheet.
(Use a scale of 2 cm = 10 units on both axis).
Use the ogive to estimate the :
(i) median.
View SolutionThe marks obtained by 100 students in a Mathematics test are given below :

Draw an ogive for the given distribution on a graph sheet.
(Use a scale of 2 cm = 10 units on both axis).
Use the ogive to estimate the number of students who obtained more than 85% marks in the test.
View SolutionThe marks obtained by 100 students in a Mathematics test are given below :

Draw an ogive for the given distribution on a graph sheet.
(Use a scale of 2 cm = 10 units on both axis).
Use the ogive to estimate the number of students who did not pass in the test if the pass percentage was 35.
View SolutionUse graph paper for this question.
The marks obtained by 120 students in an English test are given below :


Draw the ogive and hence, estimate :
the median marks.
View SolutionThe marks of 8 students in an examination in Statistics and Mathematics are given below

Find Spearman's rank Correlation coefficient.
View Solution
