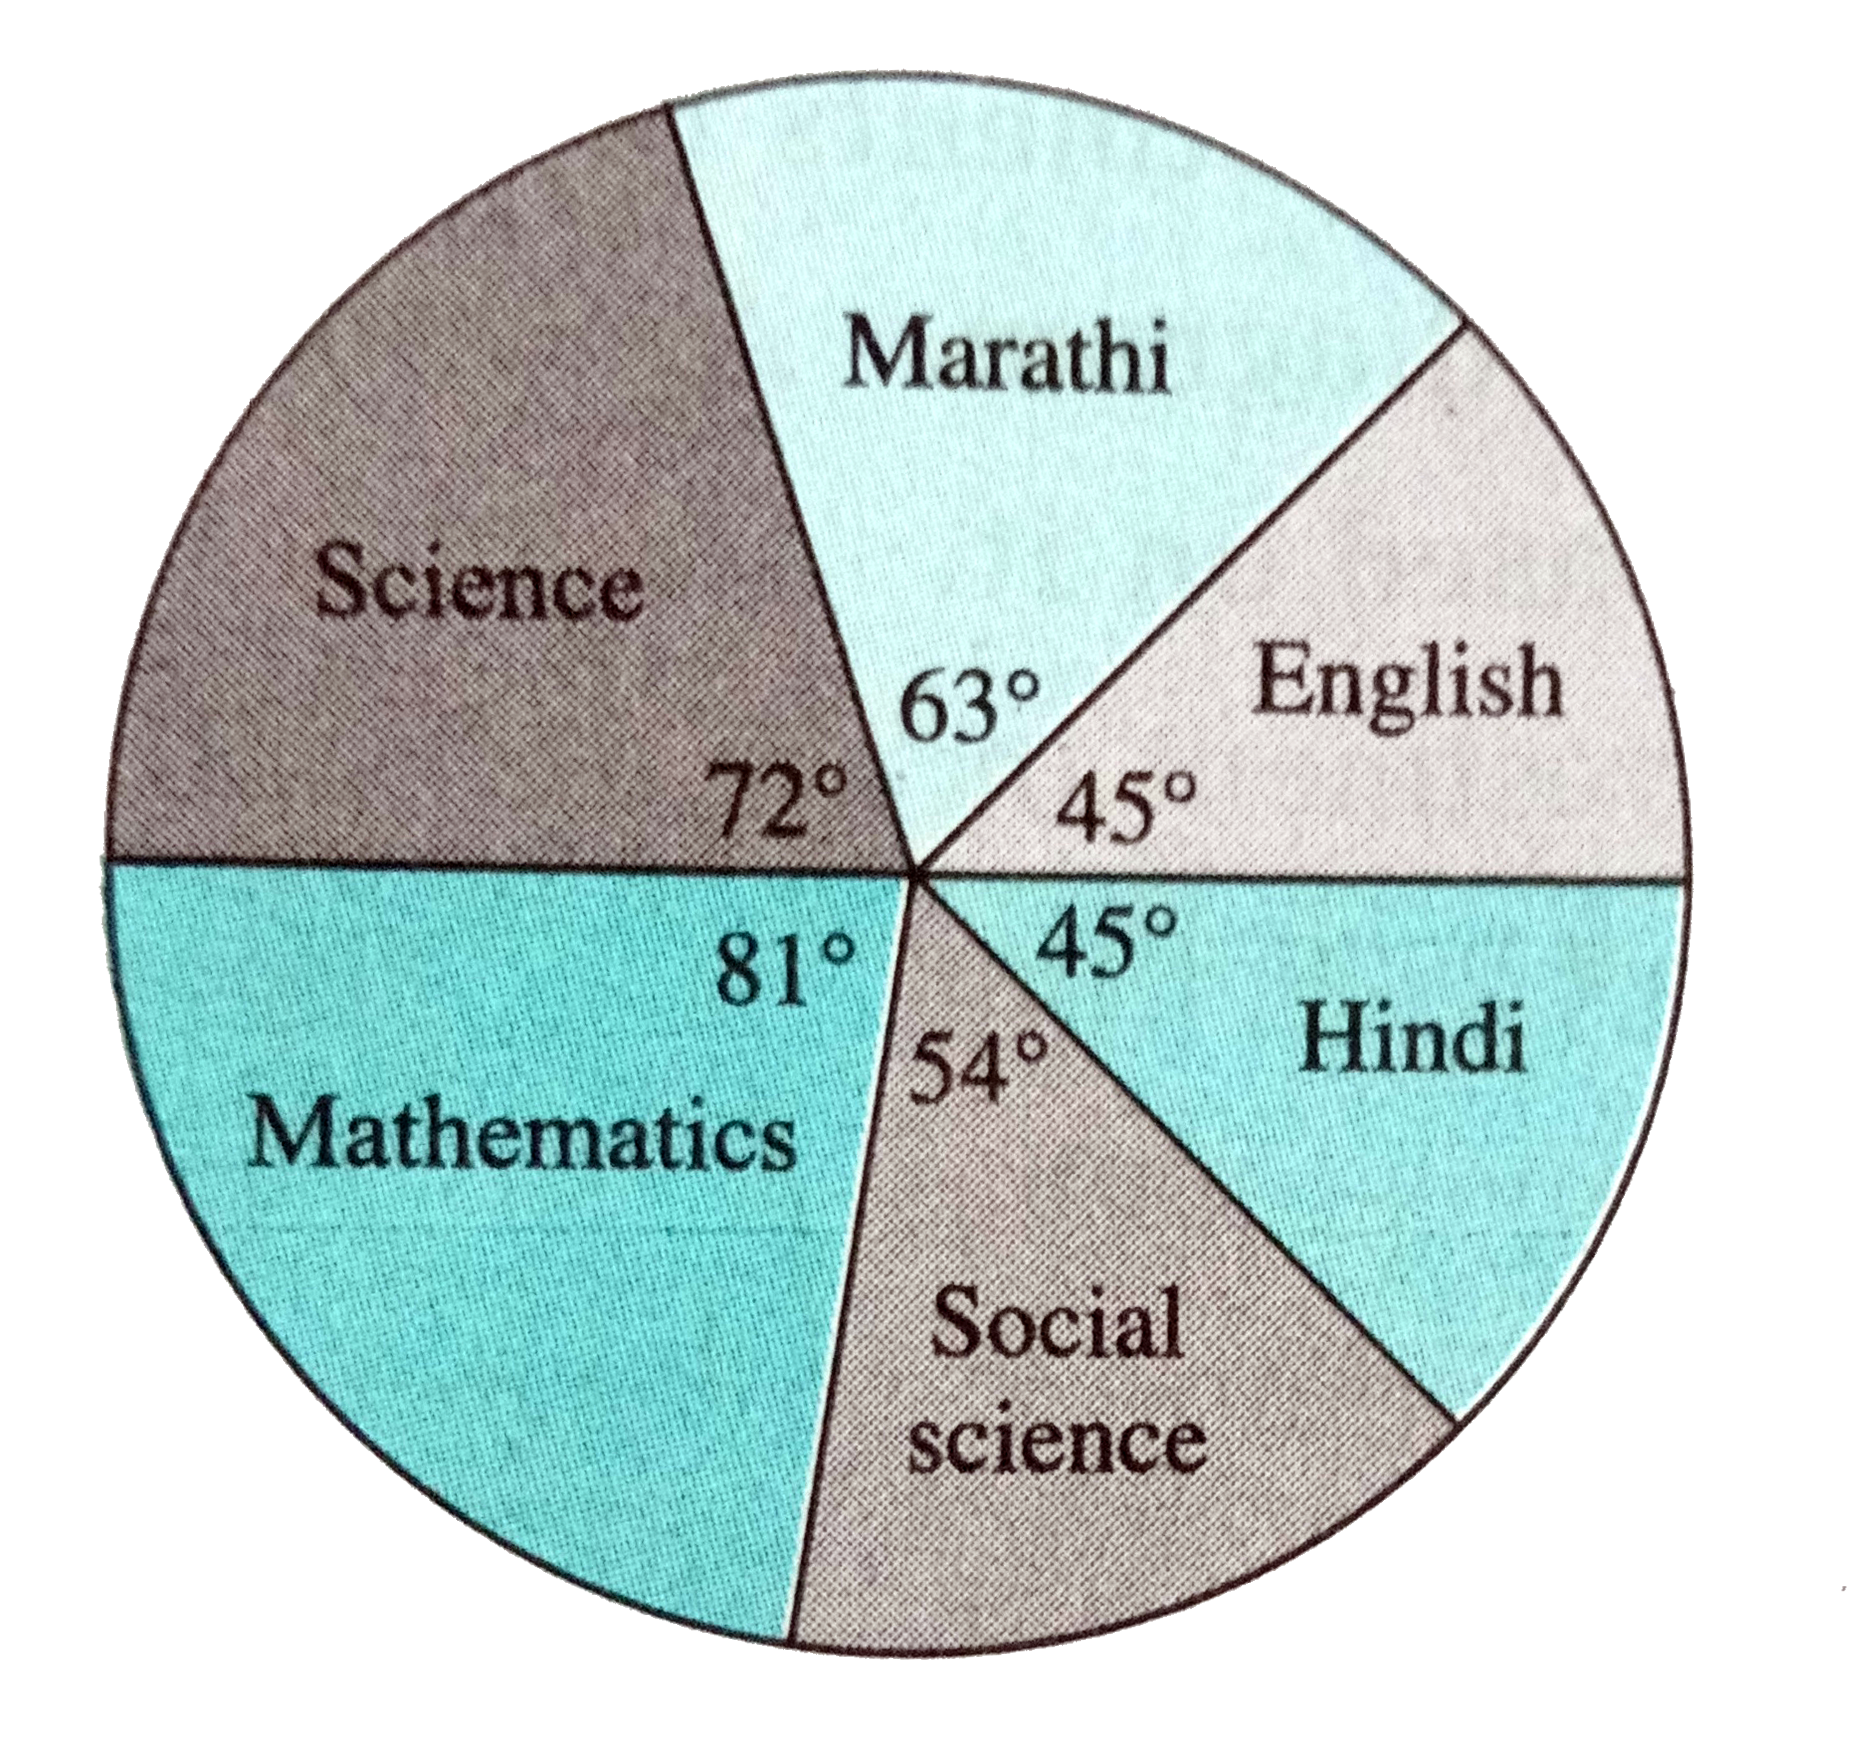
The marks obtained by a student in defferent subjects are shown. Draw a pie diagram showing the information.

The marks obtained are converted into component parts of 360∘ in the following table :
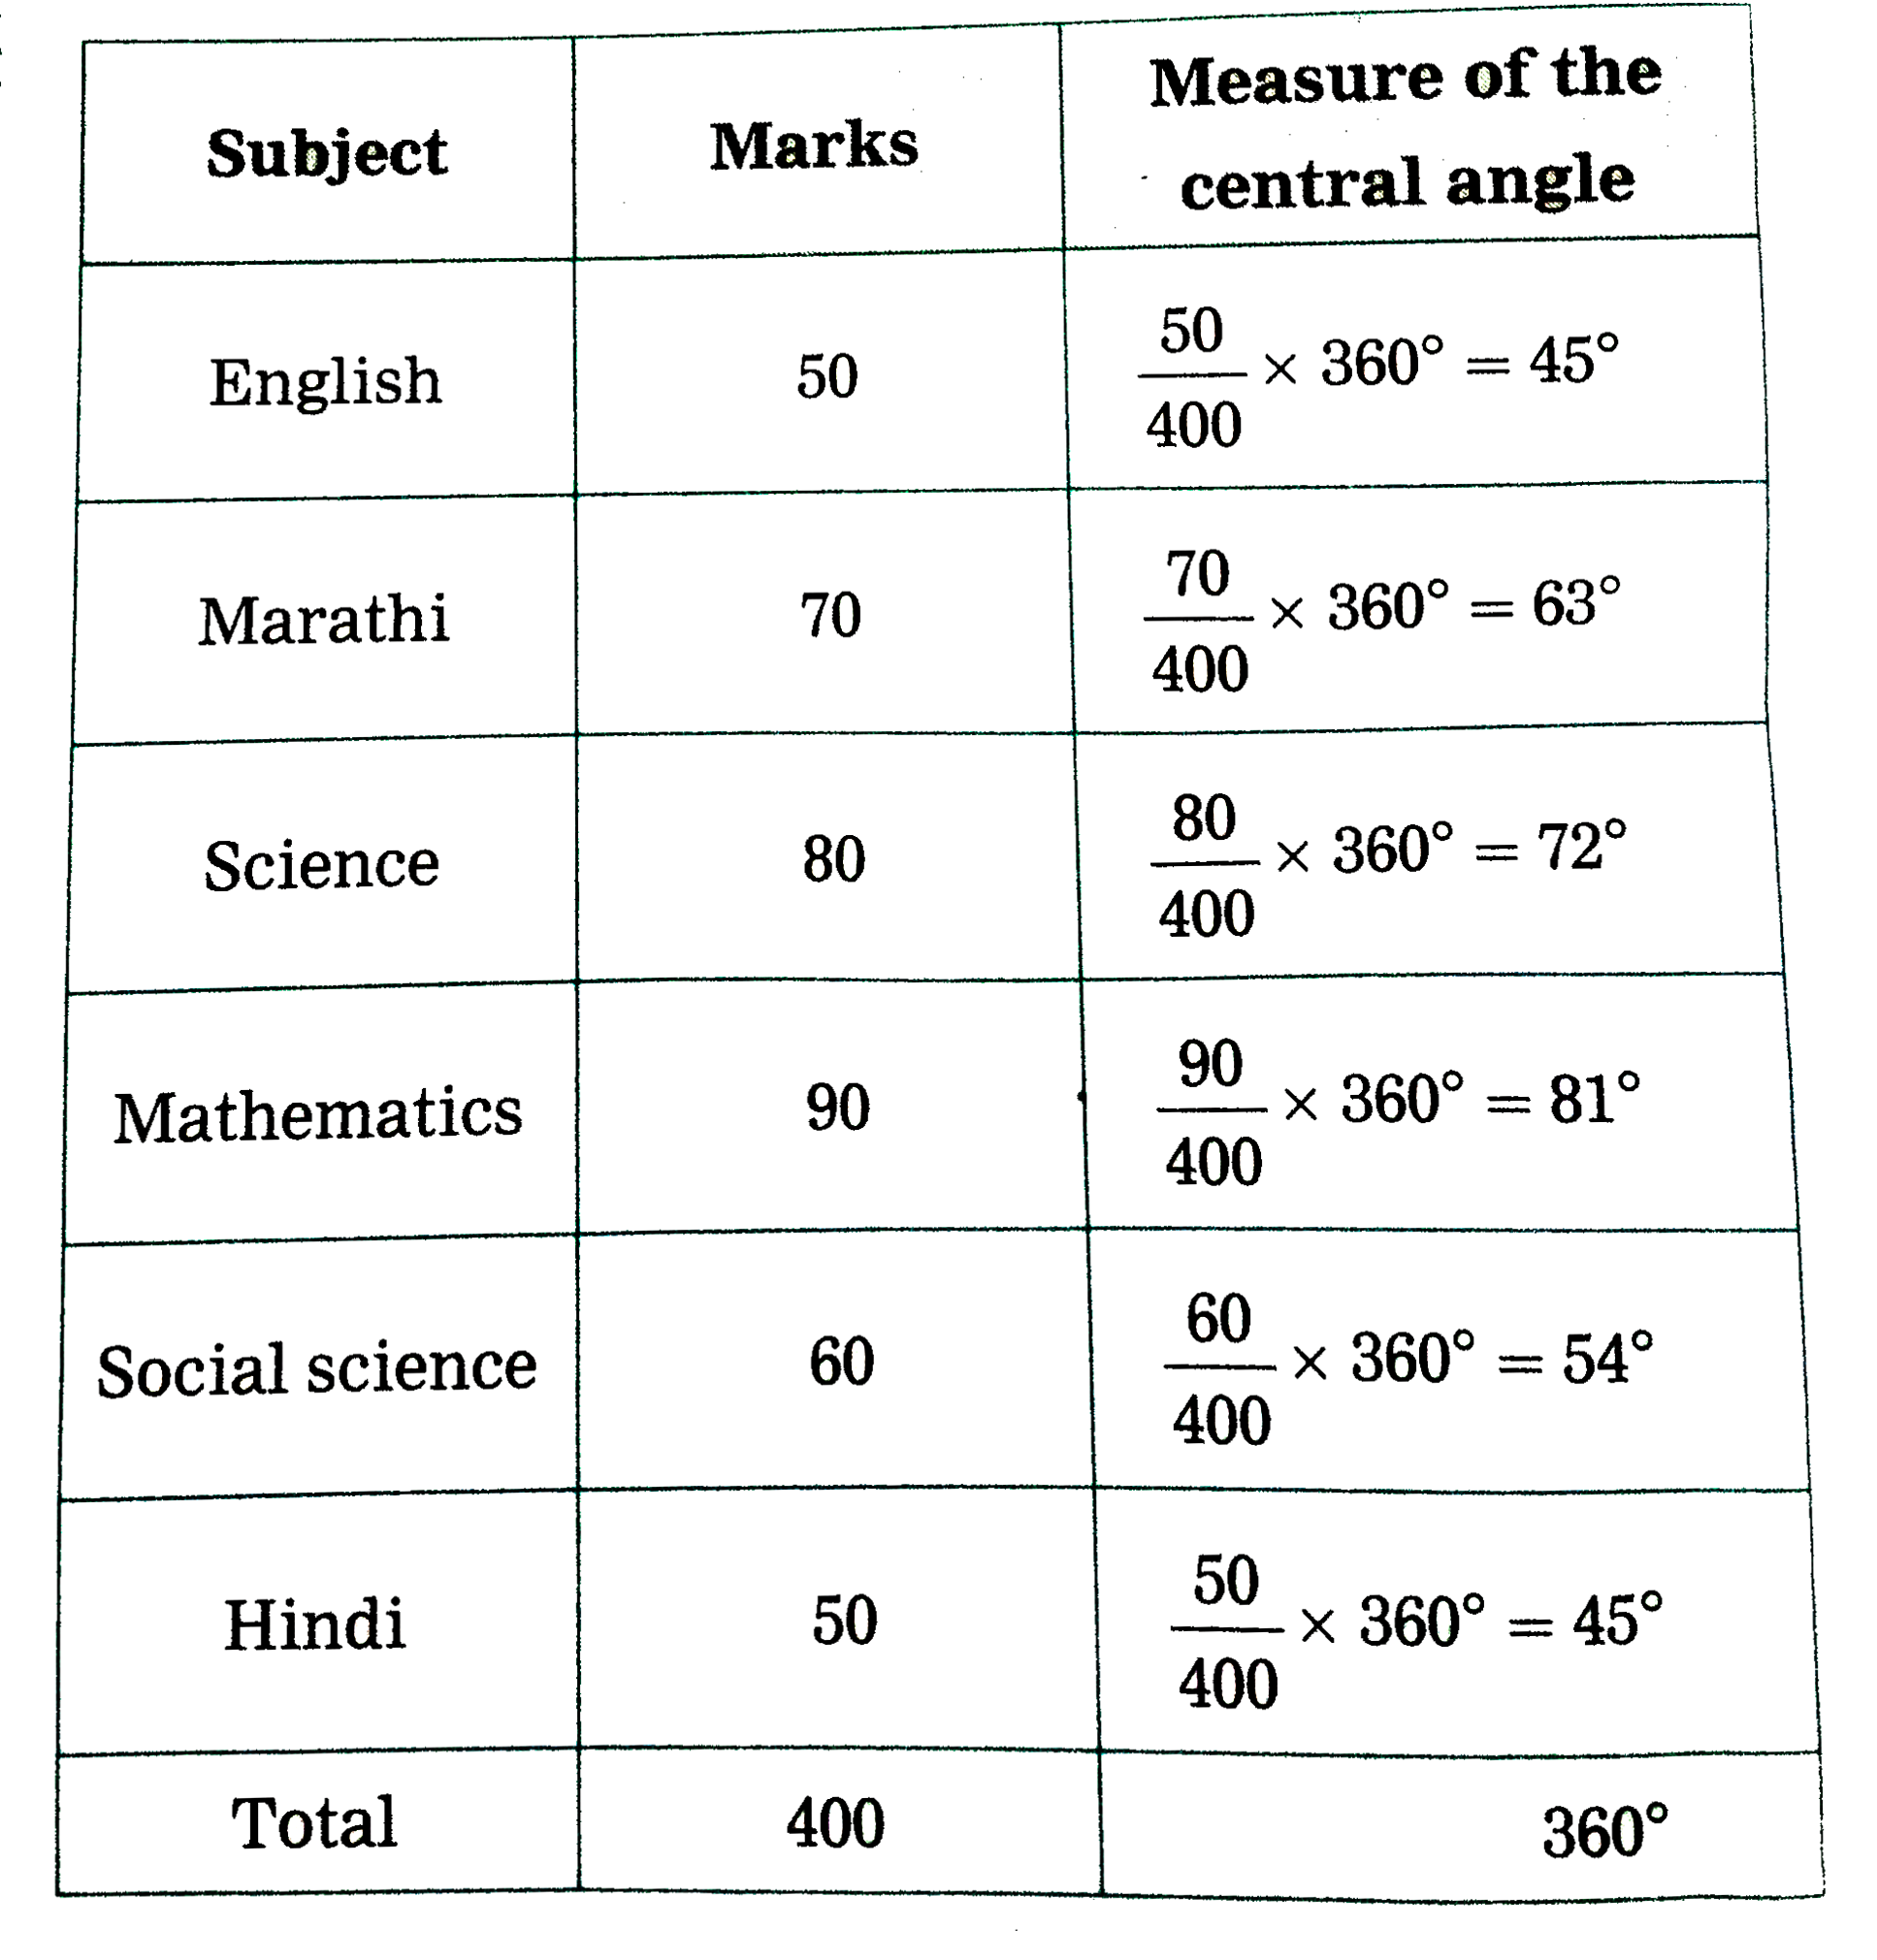
On the basis of the table, the pie diagram is drawn below :
Topper's Solved these Questions
- STATISTICSBOOK - NAVNEET PUBLICATION - MAHARASHTRA BOARDCHAPTER - STATISTICSEXERCISE - Challenging Questions
2 Videos
- STATISTICSBOOK - NAVNEET PUBLICATION - MAHARASHTRA BOARDCHAPTER - STATISTICSEXERCISE - EXAMPLES FOR PRACTICE (MCQs)
35 Videos
- STATISTICSBOOK - NAVNEET PUBLICATION - MAHARASHTRA BOARDCHAPTER - STATISTICSEXERCISE - PRACTICE SET 6.5
3 Videos
- SIMILARITYBOOK - NAVNEET PUBLICATION - MAHARASHTRA BOARDCHAPTER - SIMILARITYEXERCISE - SUBJECTIVE TYPE
20 Videos
- THEOREMS BOOK - NAVNEET PUBLICATION - MAHARASHTRA BOARDCHAPTER - THEOREMS EXERCISE - CIRCLE
15 Videos
Similar Questions
The marks obtained by a student in different subjects are shown. Draw a pie diagram showing the information.

View SolutionIn a tree plantation programme, the number of trees planted by students of different classes is given in the following table. Draw a pie diagram showing the information.

View Solution
Knowledge Check
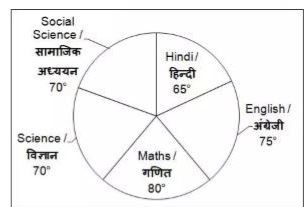
The given pie chart shows the marks obtained in degrees) by a student in different subjects. The total marks obtained by the student in the examination is 432.
In how many subjects marks obtained are more than the average marks per subject?
 A3B1C2D4
The given pie-chart shows the marks obtained (in degrees) by a student in different subjects. The total marks obtained by the student in the examination is 432.
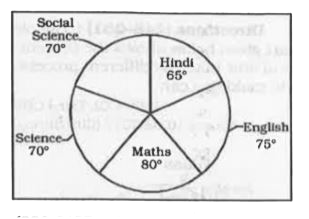
The marks obtained in Maths is how much per cent more than the marks obtained in Social Science?A7.14B14.28C9.13D10.41The given pie-chart shows the marks obtained (in degrees) by a student in different subjects. The total marks obtained by the student in the examination is 432.
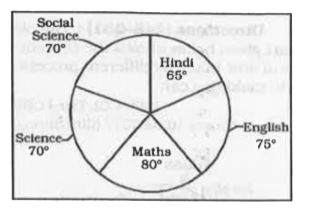
The marks obtained in Science in what percentage of the total marks?A20.14B18.12C17.16D19.44
In a tree plantation programme, the number of trees planted by students of different classes is given in the following table. Draw a pie diagram showing the information.

View SolutionThe table given below represents the marks obtained by 5 students in 4 different subjects. Each student was given marks out of 100 in each of the given subjects.

In which subject the total marks of all the students is highest ?
View SolutionThe given pie-chart shows the marks obtained (in degrees) by a student in different subjects. The total marks obtained by the student in the examination is 432.

The marks obtained in Science in what percentage of the total marks?
View SolutionThe given pie-chart shows the marks obtained (in degrees) by a student in different subjects. The total marks obtained by the student in the examination is 432.
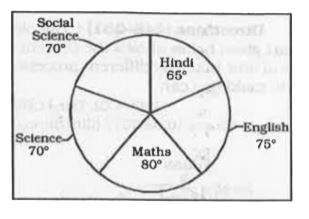
What is the total of marks obtained in Hindi and Maths?
View SolutionThe given pie-chart shows the marks obtained (in degrees) by a student in different subjects. The total marks obtained by the student in the examination is 432.

What is the total of marks obtained in Hindi and Maths?
View Solution
