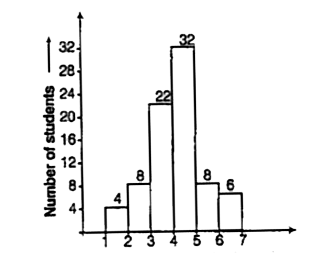
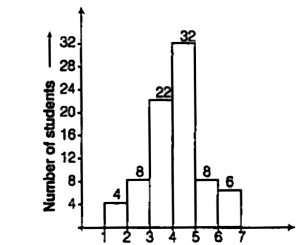
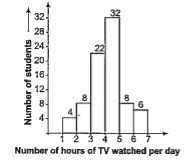
The number of hours for which students of a particular class watched television during holidays is shown through the given graph.Answer the following.(i) For how many hours did the maximum number of students watch TV?(ii) How many students watched TV for less than 4 hours?(iii) How many students spent more than 5 hours in watching TV?
(i) We can see from the given graph that maximum number of students are 32 and they watch TV from 4 to 5 hours.
(ii)Number of students who watch TV for less than 4 hours =22+8+4=34
(iii)Number of students who watch TV for more than 5 hours =8+6=14
Topper's Solved these Questions
Similar Questions
Read the given bar graph, showing the number of games played by different number of students of a school.
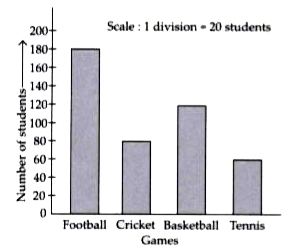
How many students play Cricket and Tennis together ?
View SolutionNumber of wrist watches manufactured by a factory in six days of a particular week is given below.
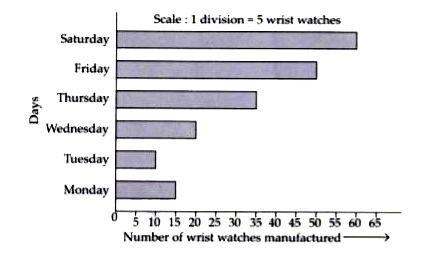
Read the bar graph and answer the following questions.
On which day, the maximum number of wrist watches were manufactured ? How many wrist watches were manufactured on that day ?
View Solution
Knowledge Check
Study the given histogram carefully and answer the questions given below it.
The number of hours for which students of a particular class watched television during holidays has been shown through the given graph.
For how many hours did the maximum number of students watched TV?A(3−4)B(5−6)C(4−5)D(6−7)Study the given histoogram carefully and answer the questions given below.
The number of hours for which students of a particular class watched television during holidays has been shown through the given grahp.
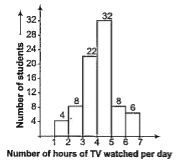
For how many hours did the maximum number of students watch TV ?A(3−4)B(5−6)C(4−5)D(6−7)Study the given histogram carefully and answer the questions given below it.
The number of hours for which students of a particular class watched television during holidays has been shown through the given graph.
How many students watched TV for less than 4h?A30B28C22D34
The given bar graph, shows the number of students in different classes.
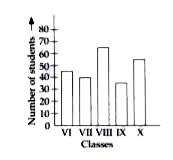
How many more students are there in class VIII than in class IX?
View SolutionThe total number of students who applied for scholarship in the last five years is given below :

Using the symbol to represent 500 students, answer the following questions.
(i) How many symbols are needed to represent the number of students in 2010 ?
(ii) How many more symbols are needed to represent the number of students in 2012 than in 2009 ?
View SolutionStudy the given histoogram carefully and answer the questions given below.
The number of hours for which students of a particular class watched television during holidays has been shown through the given grahp.
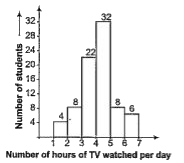
How many students watched TV for less then 4 h ?
View SolutionStudy the given histogram carefully and answer the questions given below it.
The number of hours for which students of a particular class watched television during holidays has been shown through the given graph.
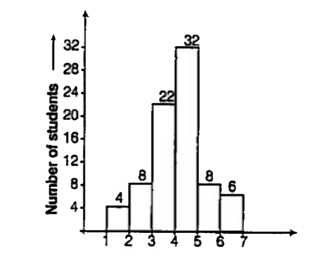
How many students spent more than 5h in watching TV?
View SolutionStudy the given histoogram carefully and answer the questions given below.
The number of hours for which students of a particular class watched television during holidays has been shown through the given grahp.
How many students spent more than 5 h in watching TV ?
View Solution
