The pie diagram in the given figure shows the proportions of different workers in a town. Answer the following questions with its help.
i. If the total workers is 10000, how many of them are in the field of construction?
ii. How many workers are working in the administration?
iii. What is the percentage of workers in production
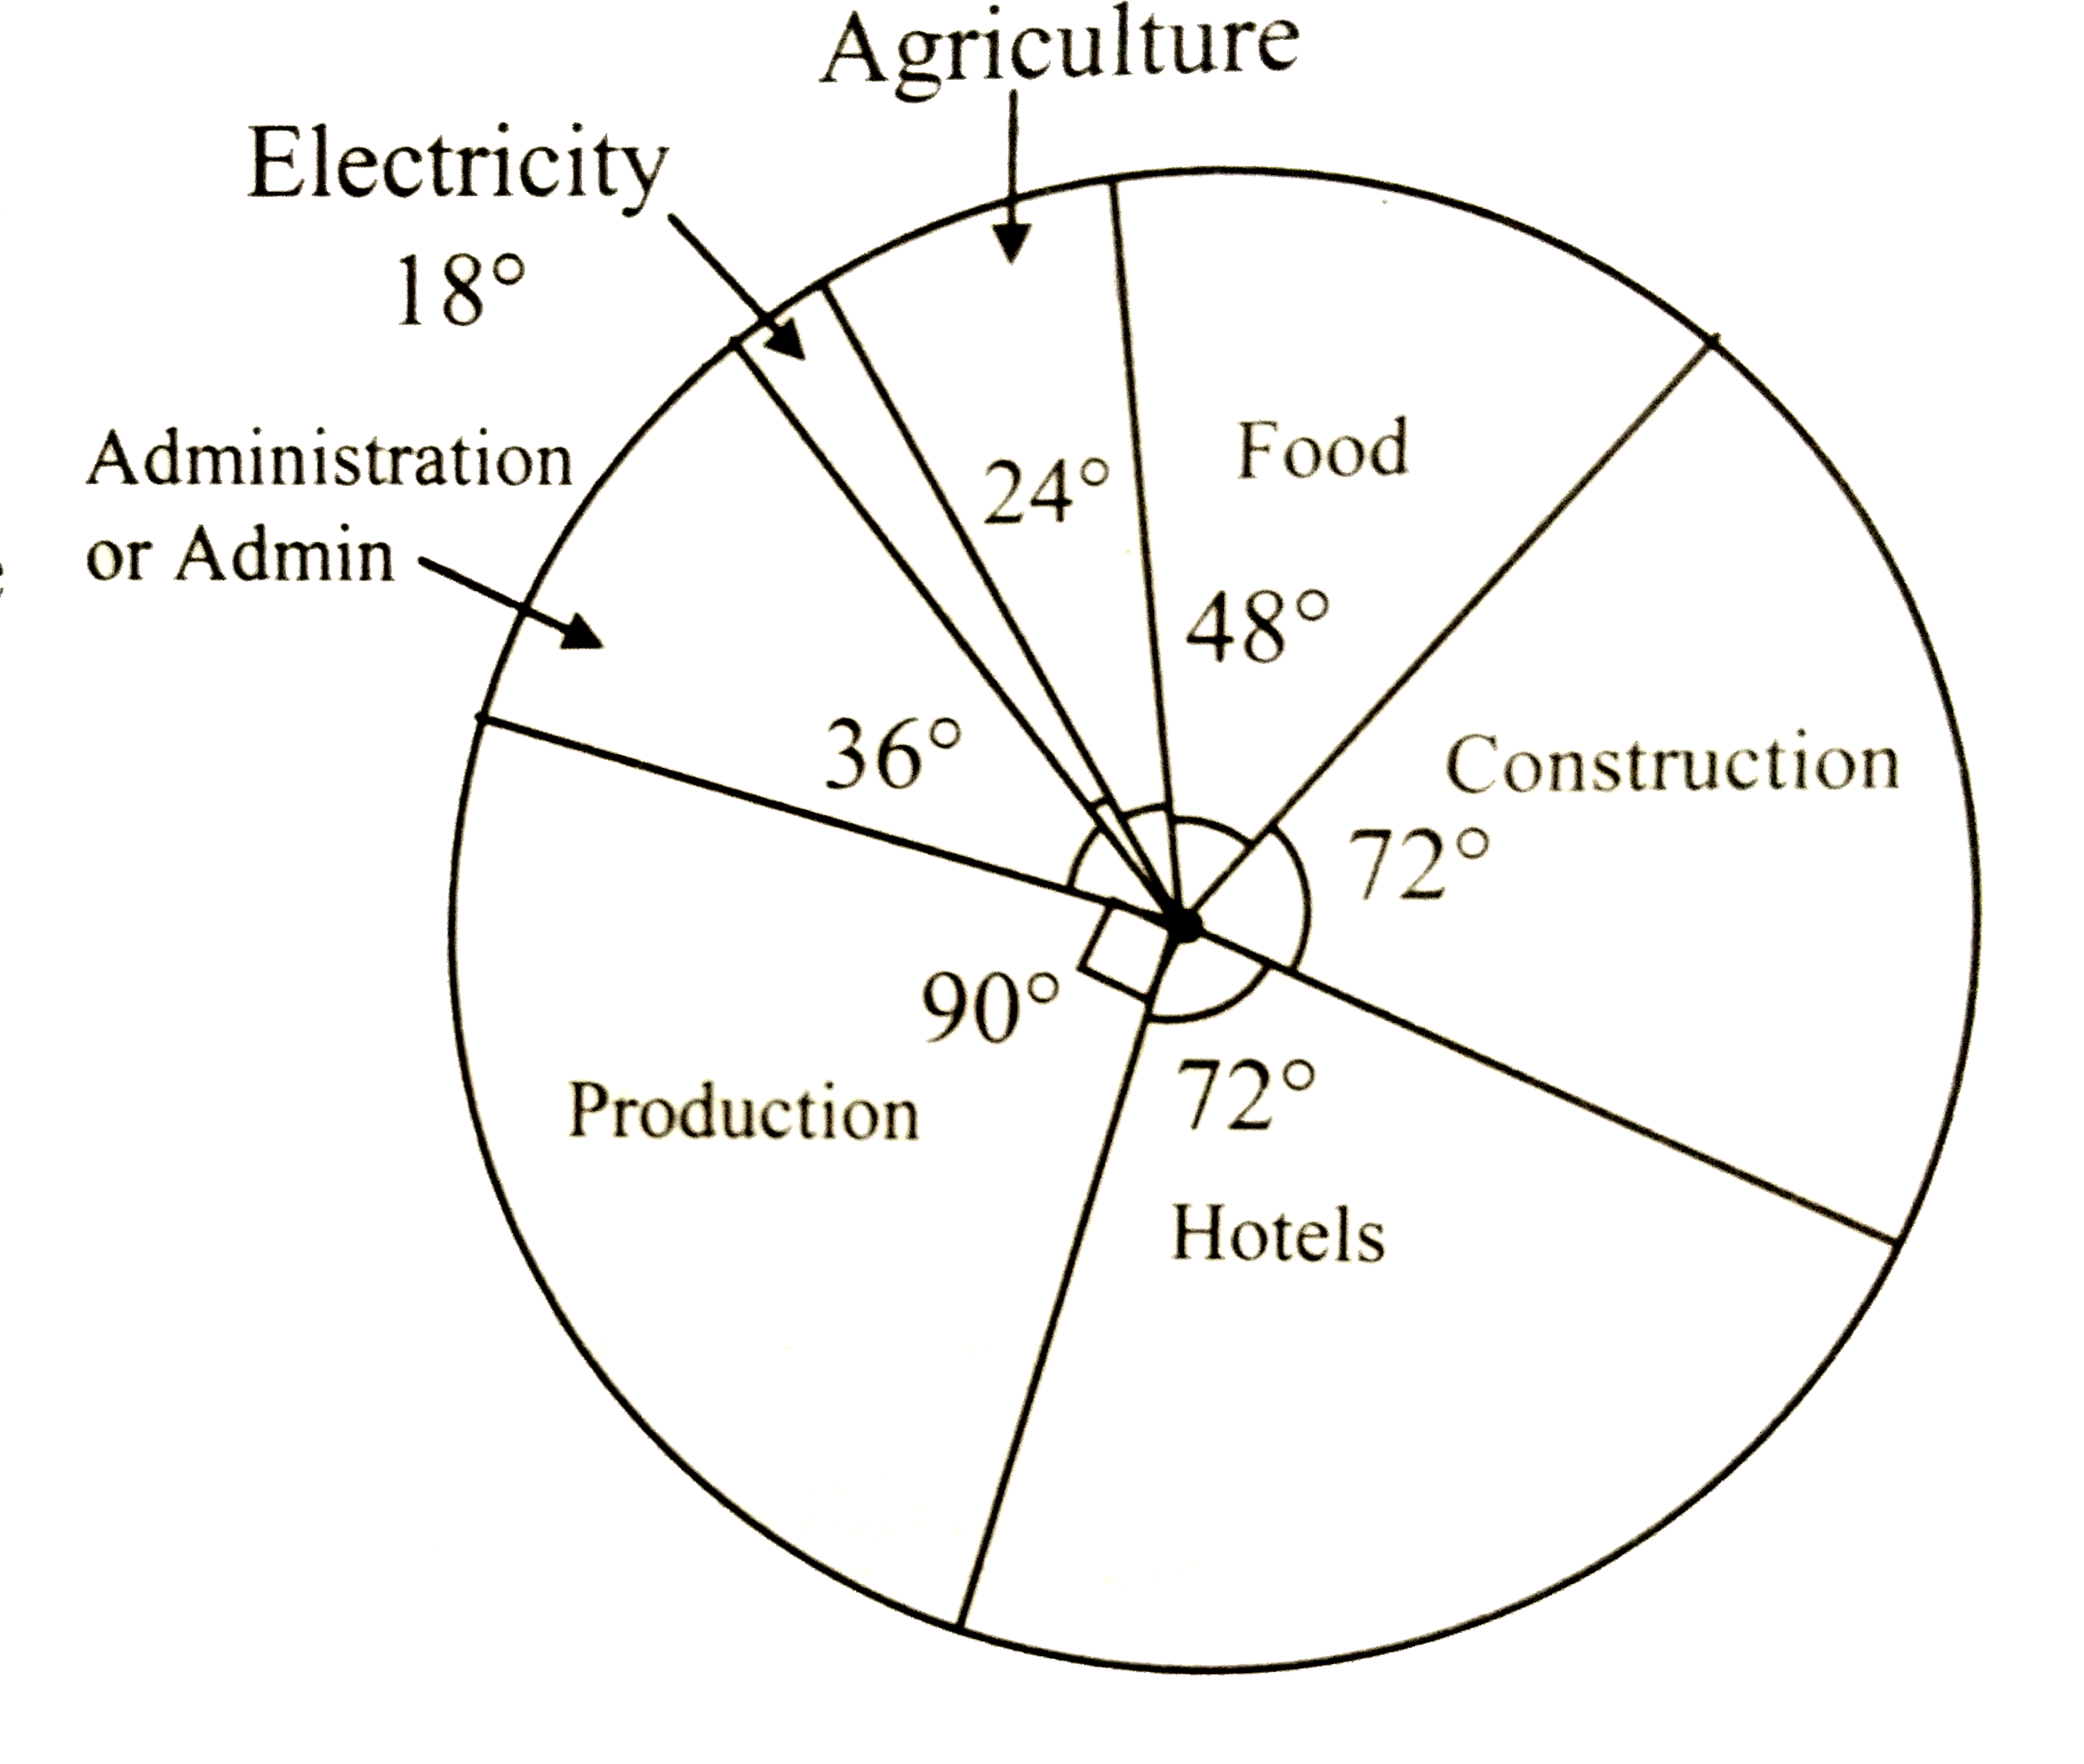
Step by step video & image solution for The pie diagram in the given figure shows the proportions of different workers in a town. Answer the following questions with its help. i. If the total workers is 10000, how many of them are in the field of construction? ii. How many workers are working in the administration? iii. What is the percentage of workers in production by Maths experts to help you in doubts & scoring excellent marks in Class 10 exams.
Updated on:21/07/2023Topper's Solved these Questions
- STATISTICSBOOK - TARGET PUBLICATIONCHAPTER - STATISTICSEXERCISE - Problem Set-6
21 Videos
- STATISTICSBOOK - TARGET PUBLICATIONCHAPTER - STATISTICSEXERCISE - Practise Set 6.5
2 Videos
- SIMILARITY BOOK - TARGET PUBLICATIONCHAPTER - SIMILARITY EXERCISE - Chapter Assessment
19 Videos
- TRIGONOMETRY BOOK - TARGET PUBLICATIONCHAPTER - TRIGONOMETRY EXERCISE - Chapter Assessment
18 Videos
Similar Questions
The pie diagram in figure, shows the proportions of different workers in a town. Answer the following questions with its help .
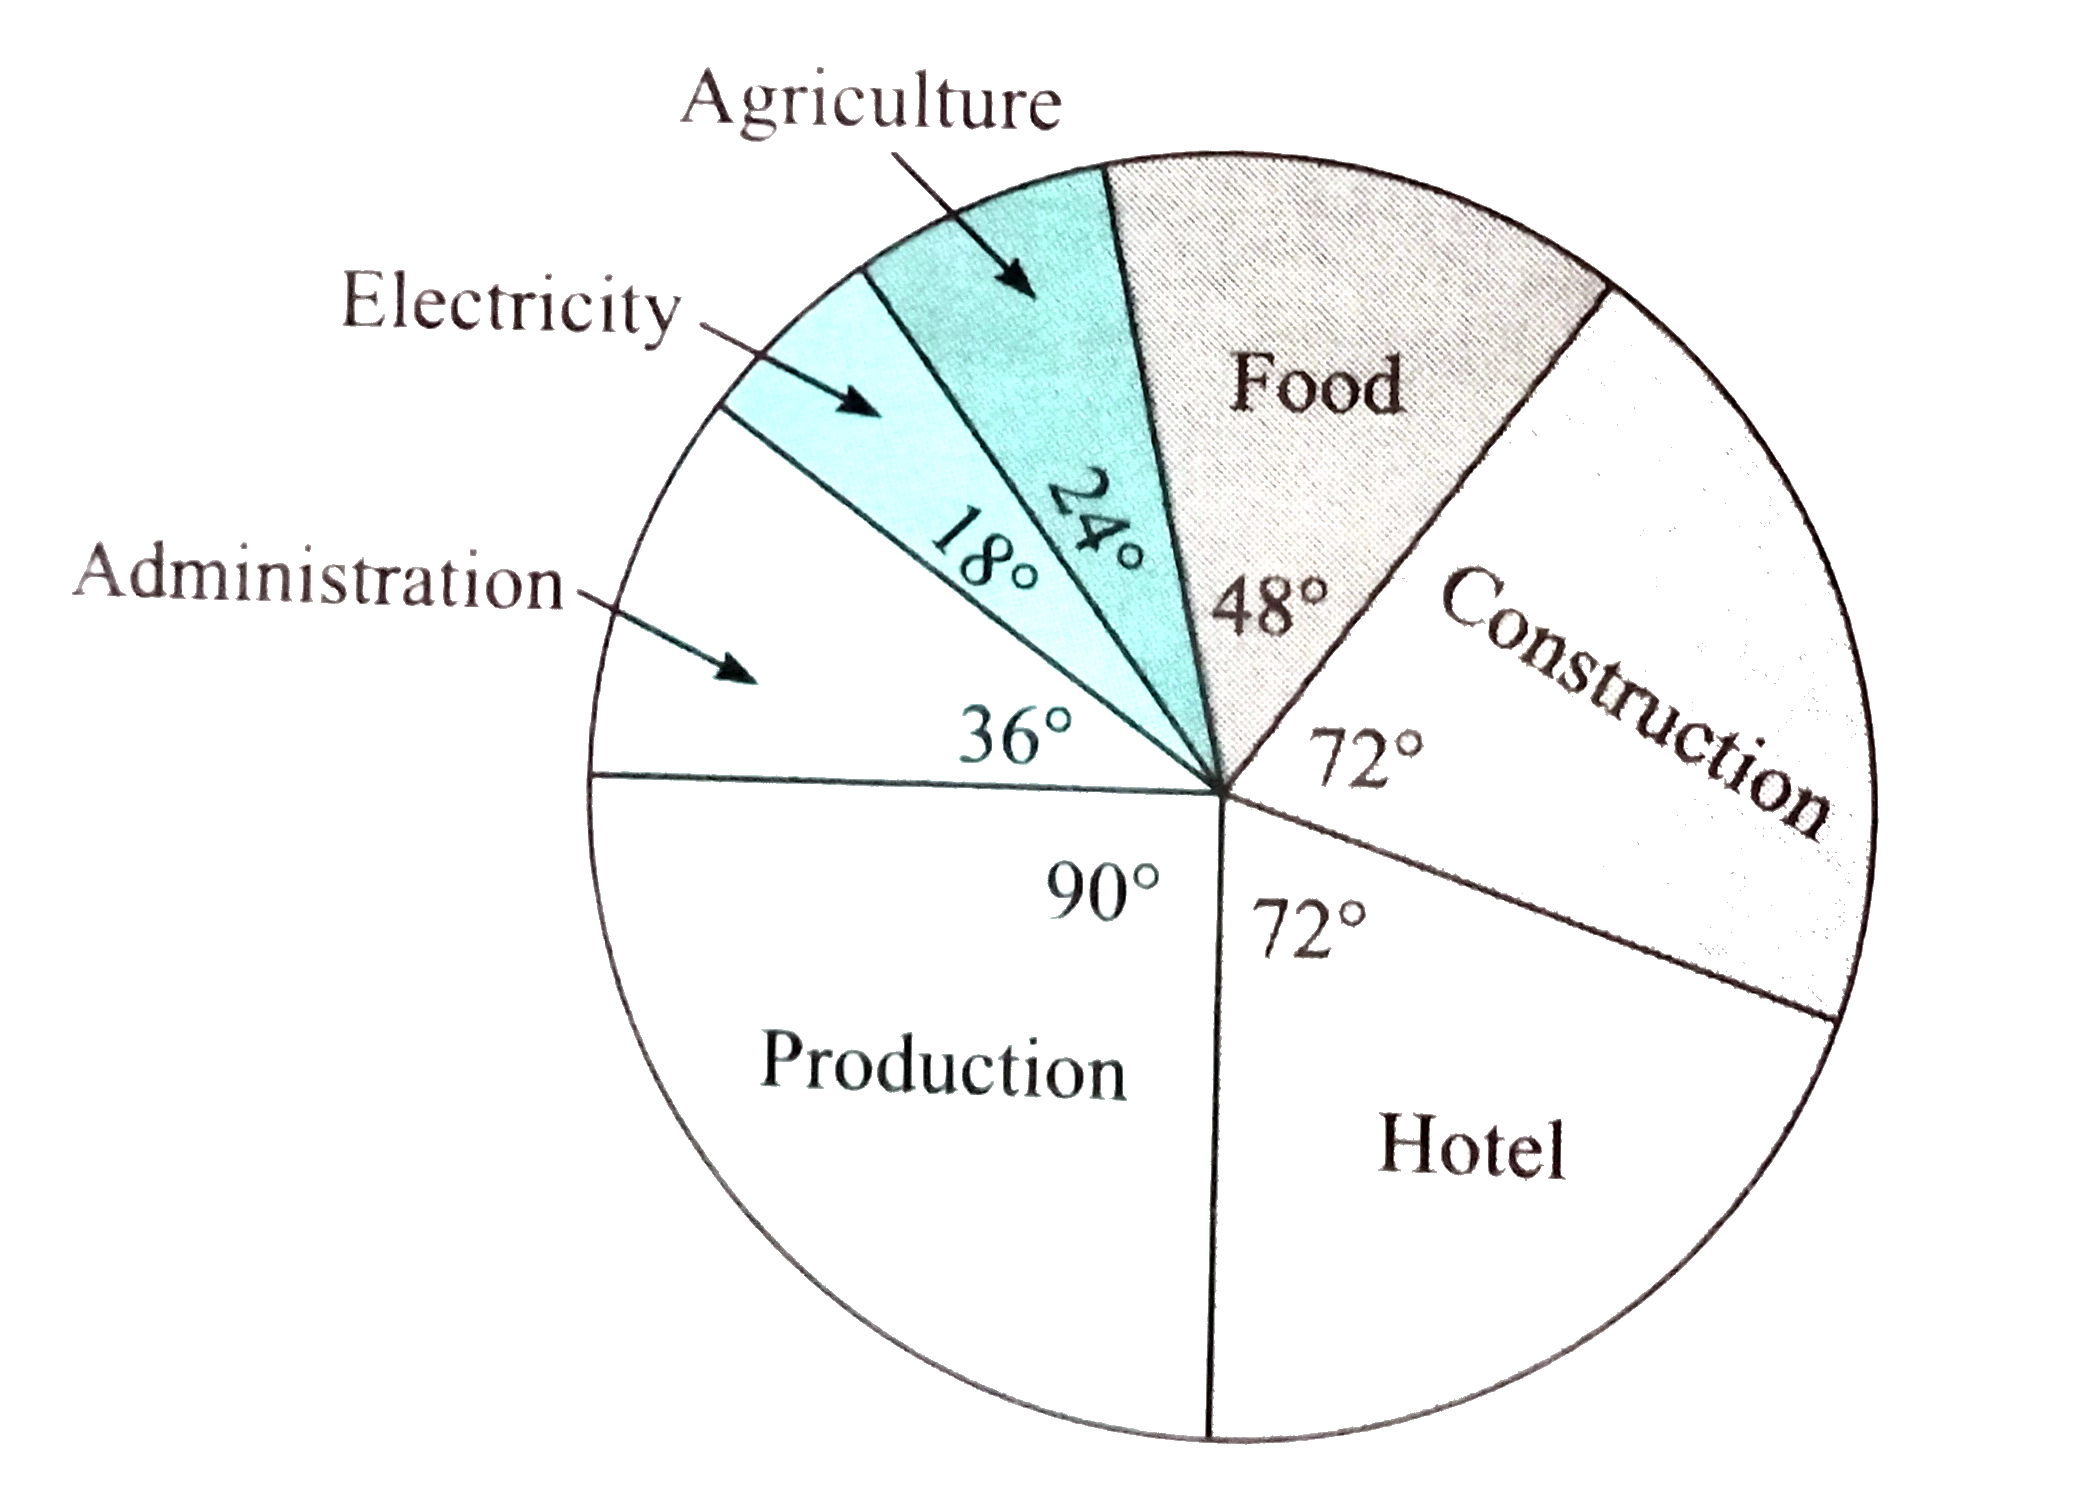
(1) If the total number of workers is 10,000, how many of them are in the field of construction ?
(2) How many workers are working in the administration ?
(3) What is the percentage of workers in the production ?
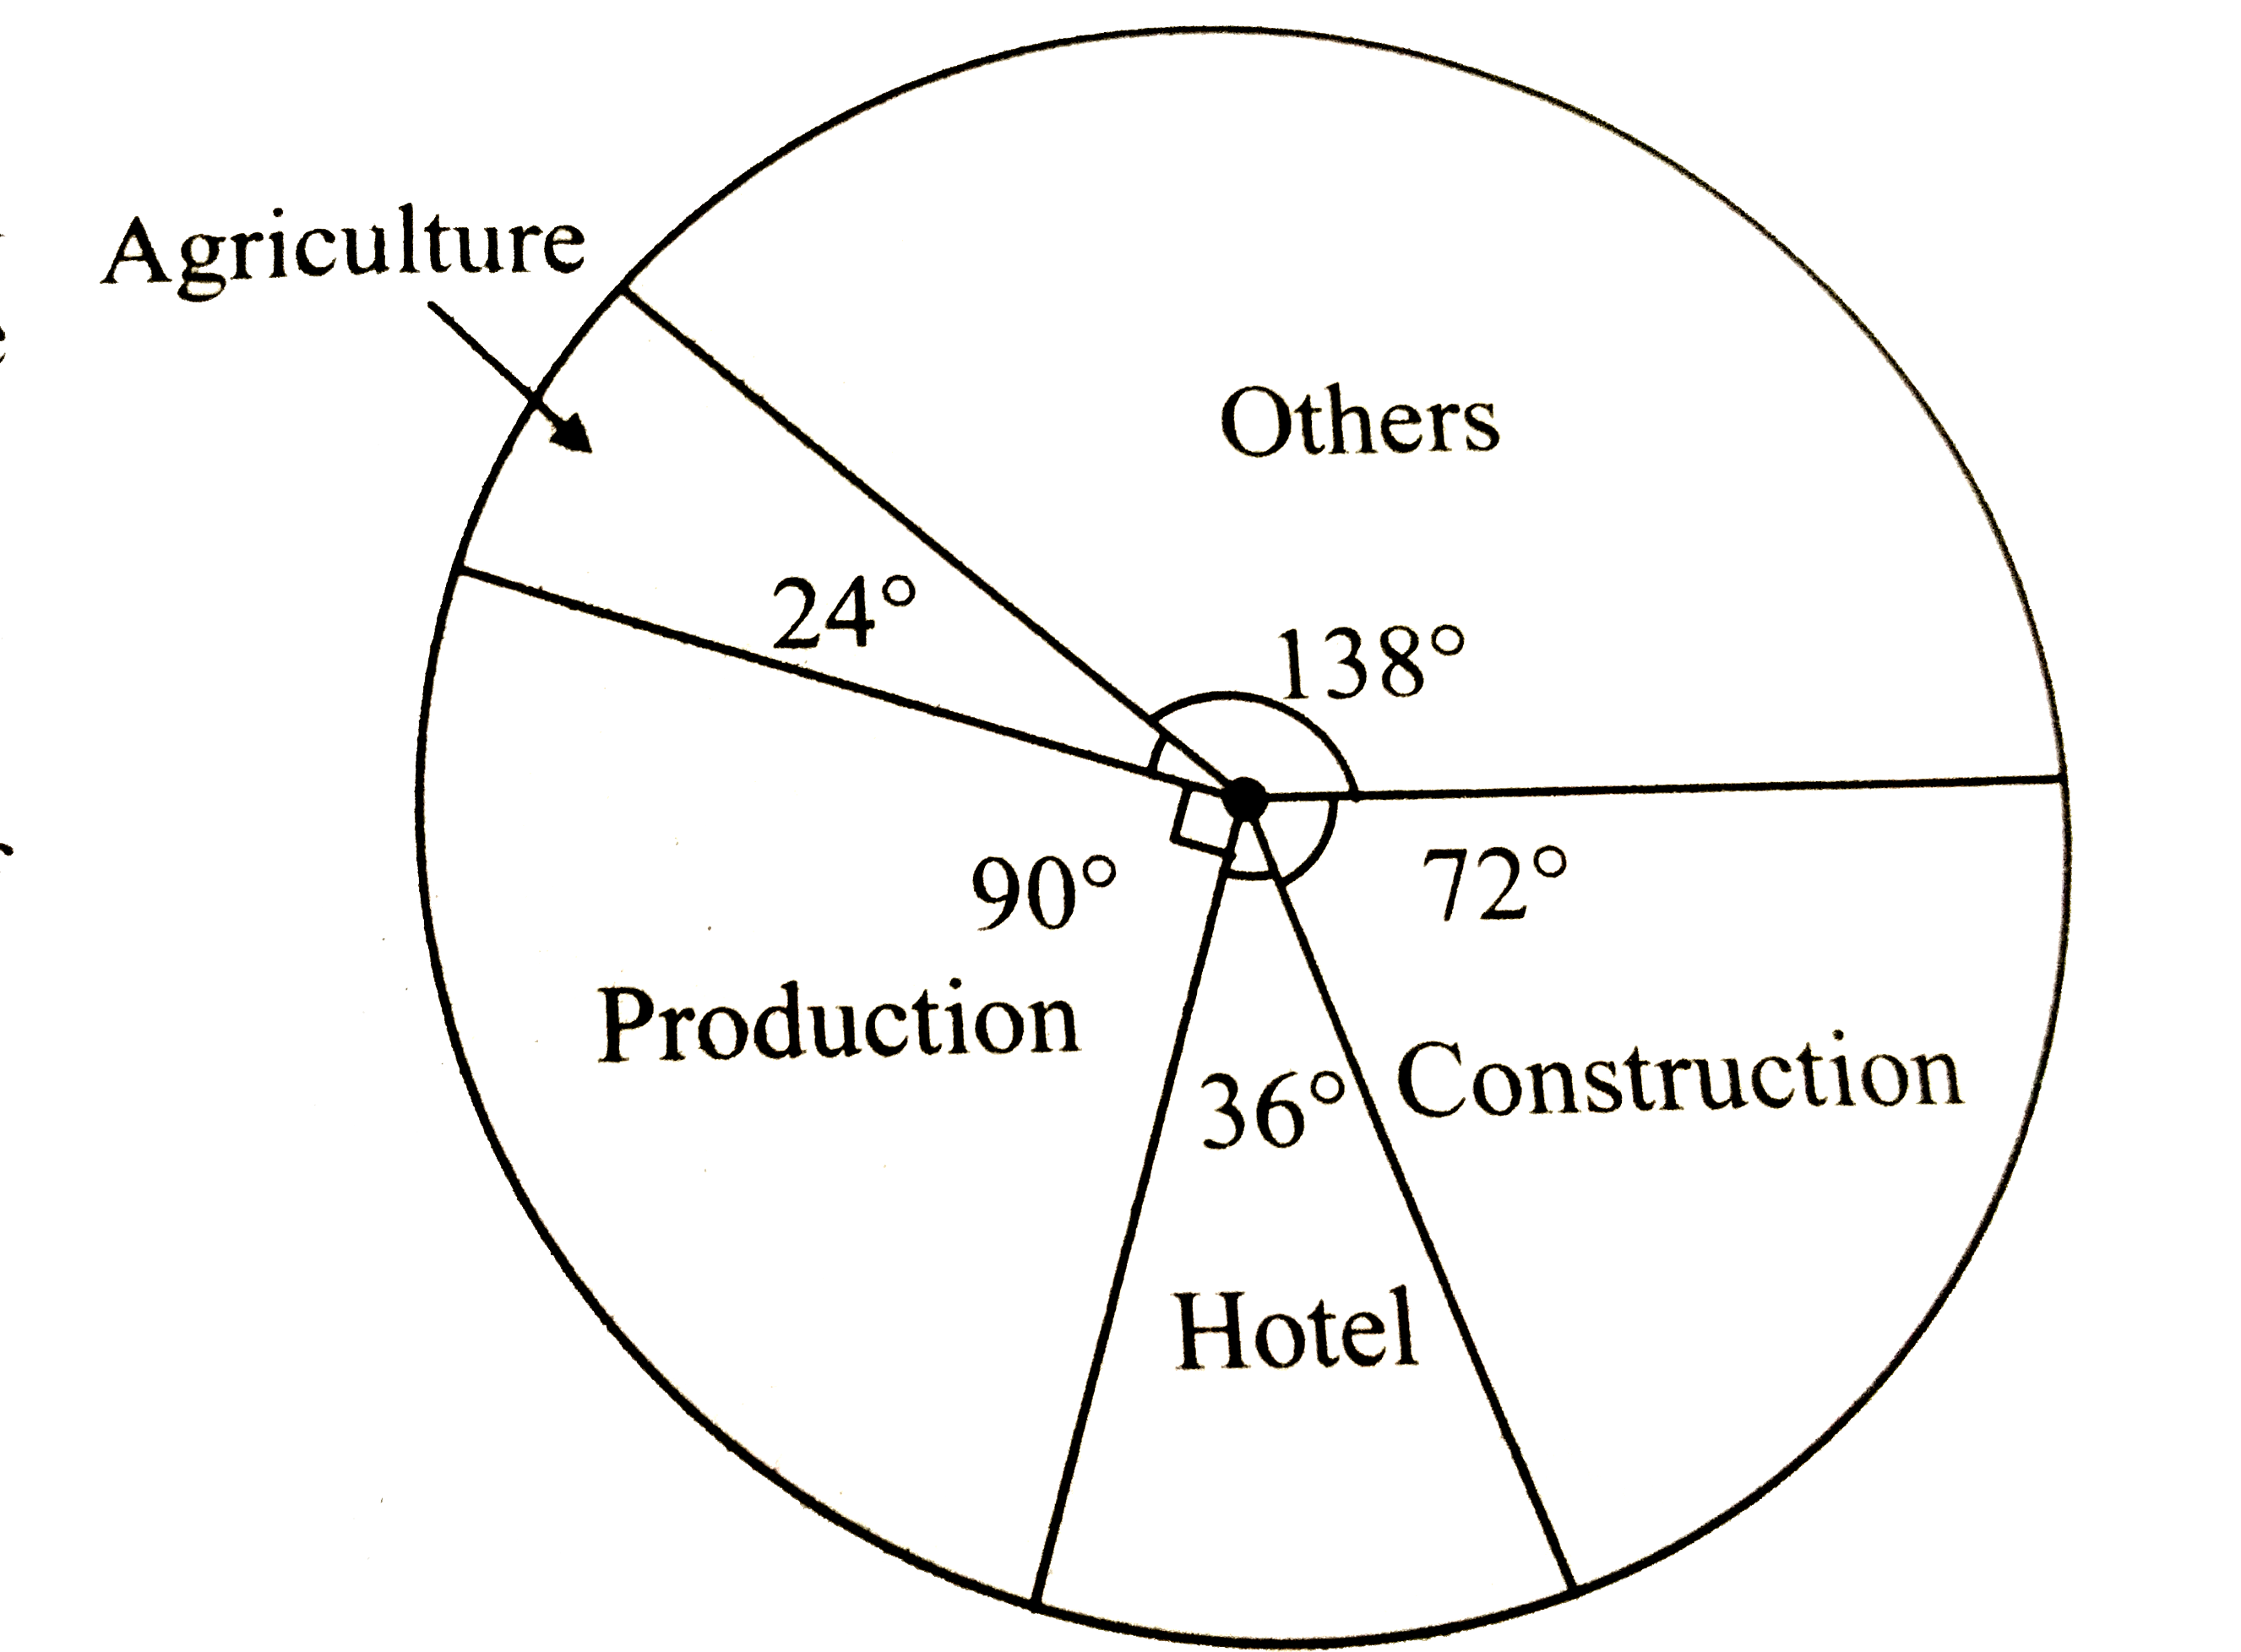
View SolutionAs deduced from a survey, the classification of skilled workers is shown in the pie diagram. If the number of workers in the production sector is 4500, answer the following questions.
i. What is the total number of skilled workers in all fields?
ii. What is the number of skilled workers in the field of constructions ?
iii. How many skilled workers are in agriculture?
iv. Find the difference between the number of workers in the field of production and construction.
View Solution
Knowledge Check
The pie chart shows the value of the total annual agricultural production of a country. Study the diagram and answer the following questions.
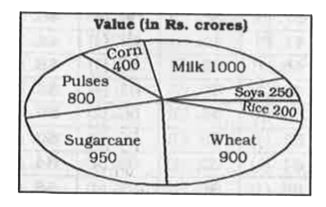
If the value of wheat is Rs. 15,000 per tonne, how many tonnes of wheat was produced?A60000B120000C600000D12000The pie chart shows the value of the total annual agricultural production of a country. Study the digram and answer the following questions.
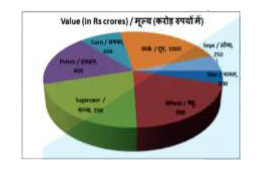
If the value of wheat is Rs. 15,000 per tonne, then how many tonnes of wheat was produced?A60000B120000C600000D12000The pie chart shows the value of the total annual production of dry fruits of a country. Study the diagram and answer the following questions.
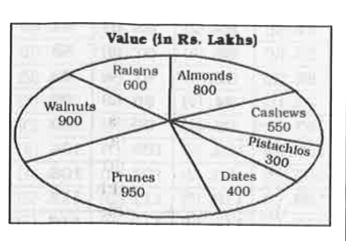
If the average of almonds produced is Rs. 800 per kg., how many kgs. Of almonds were produced?A10000B1000C100000D1000000
The pie diagram shows the classification of skilled workers.
If the number of workers in construction sector is 3600, answer the following questions:
(i) What is the total number of skilled workers in all fields?
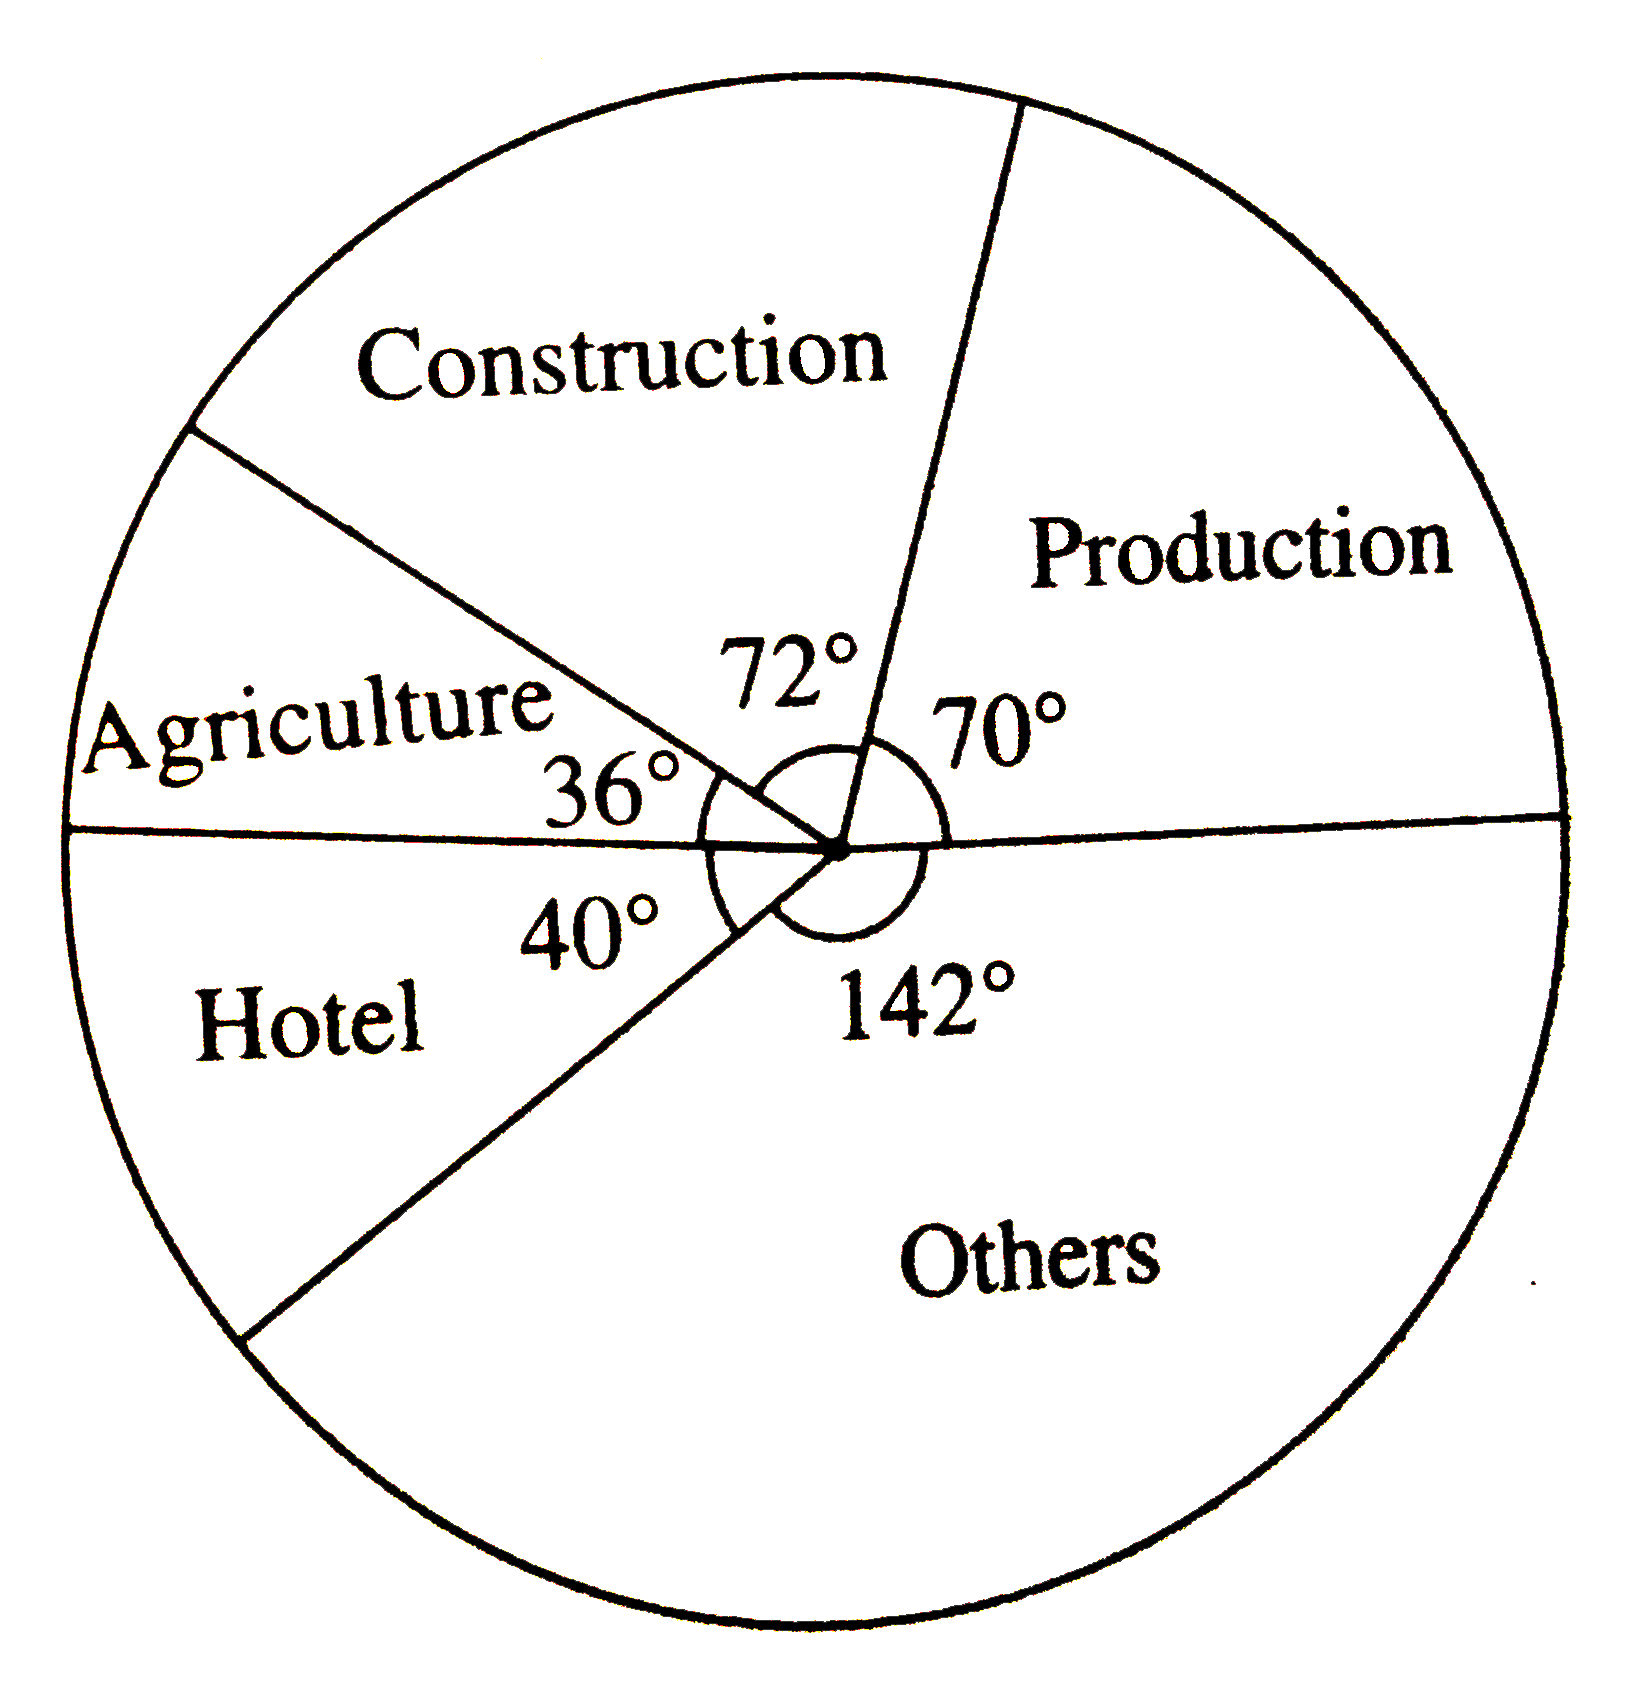
(ii) What is the number of skilled workers in hotel sector?
(iii) How many skilled workers are there in production sector?
(iv) What is the difference between the number of skilled workers in production sector and agriculture sector?
View SolutionDraw a histogram for the frequency table made for the data in Question 3, and answer the following questions.(i) Which group has the maximum number of workers?(ii) How many workers earn Rs 850 and more?(iii) How many workers earn less than Rs 850?
View SolutionThe pie chart shows the annual car production of six countries (A,B,C,D,E,F) study the diagram and answer the following question
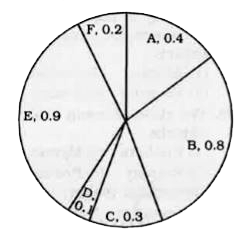
Country E produced how many more cars (in %) than that of country B
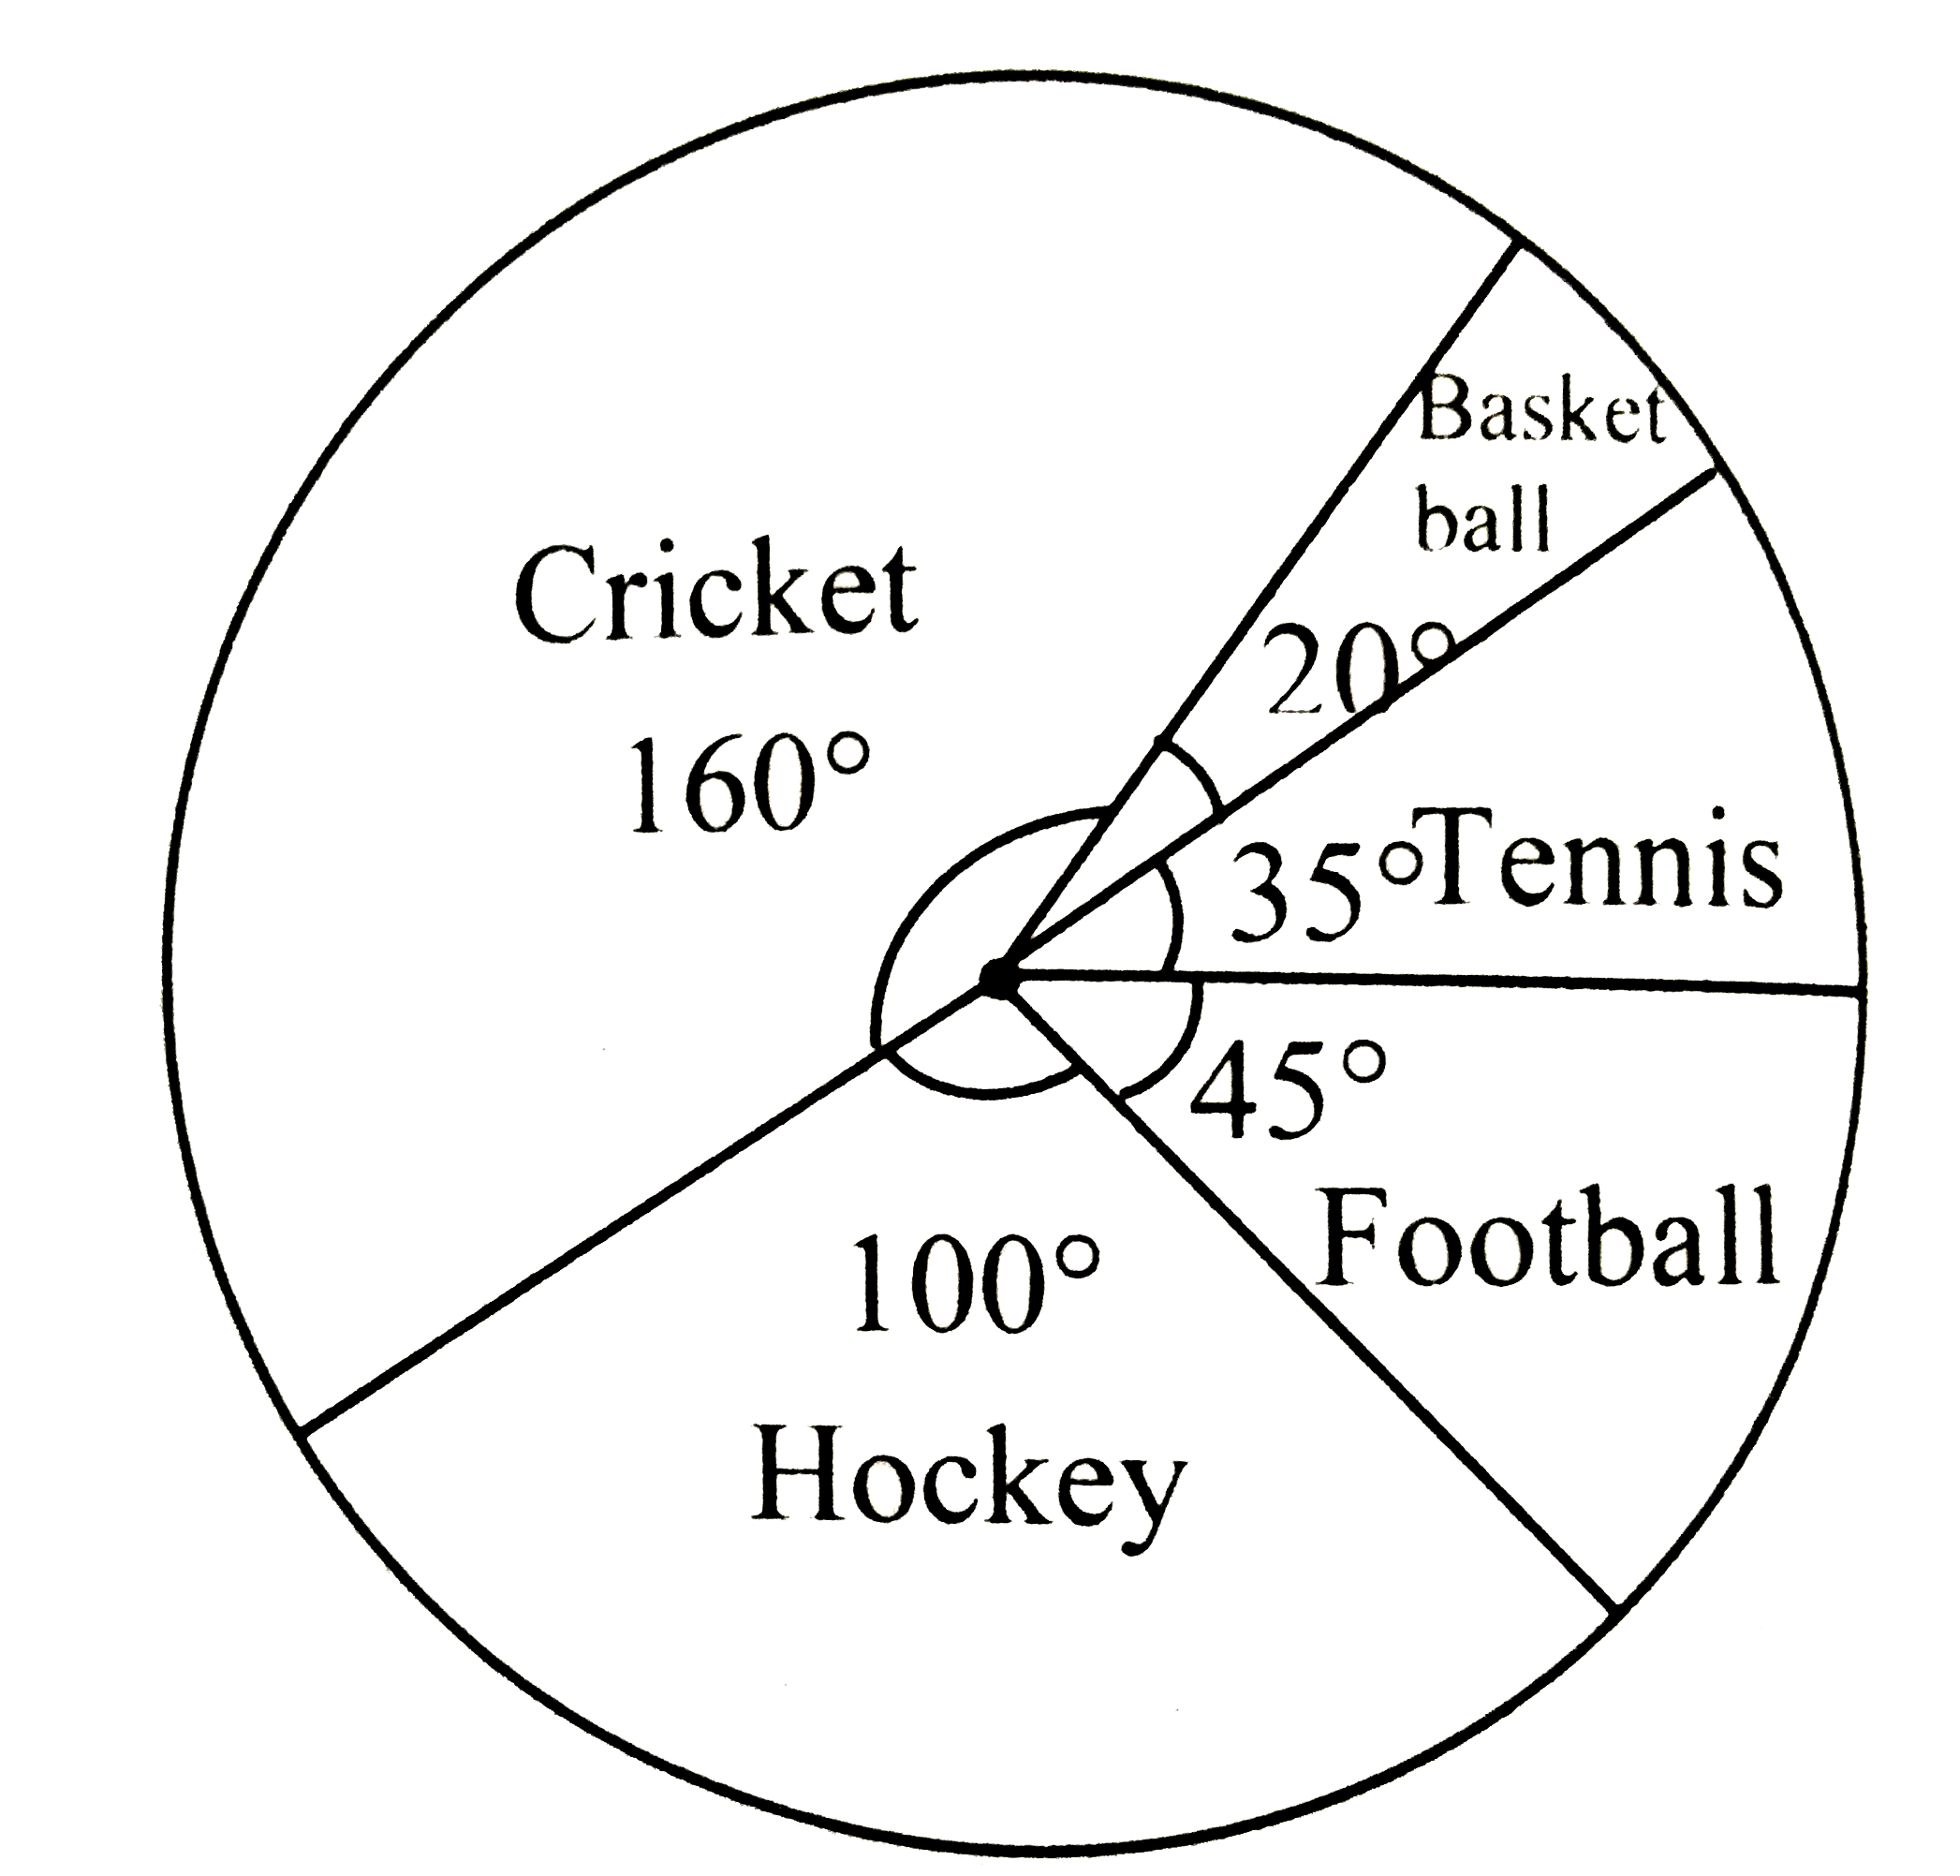
View SolutionThe pie diagram represents the amount spent on different sports by a school administration in a year. If the money spent on football is Rs9000, answer the following questions :
i. What is the total amount spent on sports?
ii. What is the amount spent on hockey?
iii. How much more amount is spent on tennis than on basket ball?
View SolutionStudy the diagram given below and answer the questions that follow by selecting the appropriate responses.
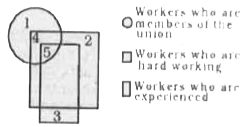
What is the total number of workers in the factory who are the members of the union?
View Solution
