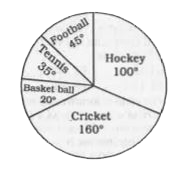
The pie diagram represents the amount spent on different sports by a school administration in a year. If the money spent on football is Rs9000, answer the following questions :
i. What is the total amount spent on sports?
ii. What is the amount spent on hockey?
iii. How much more amount is spent on tennis than on basket ball?
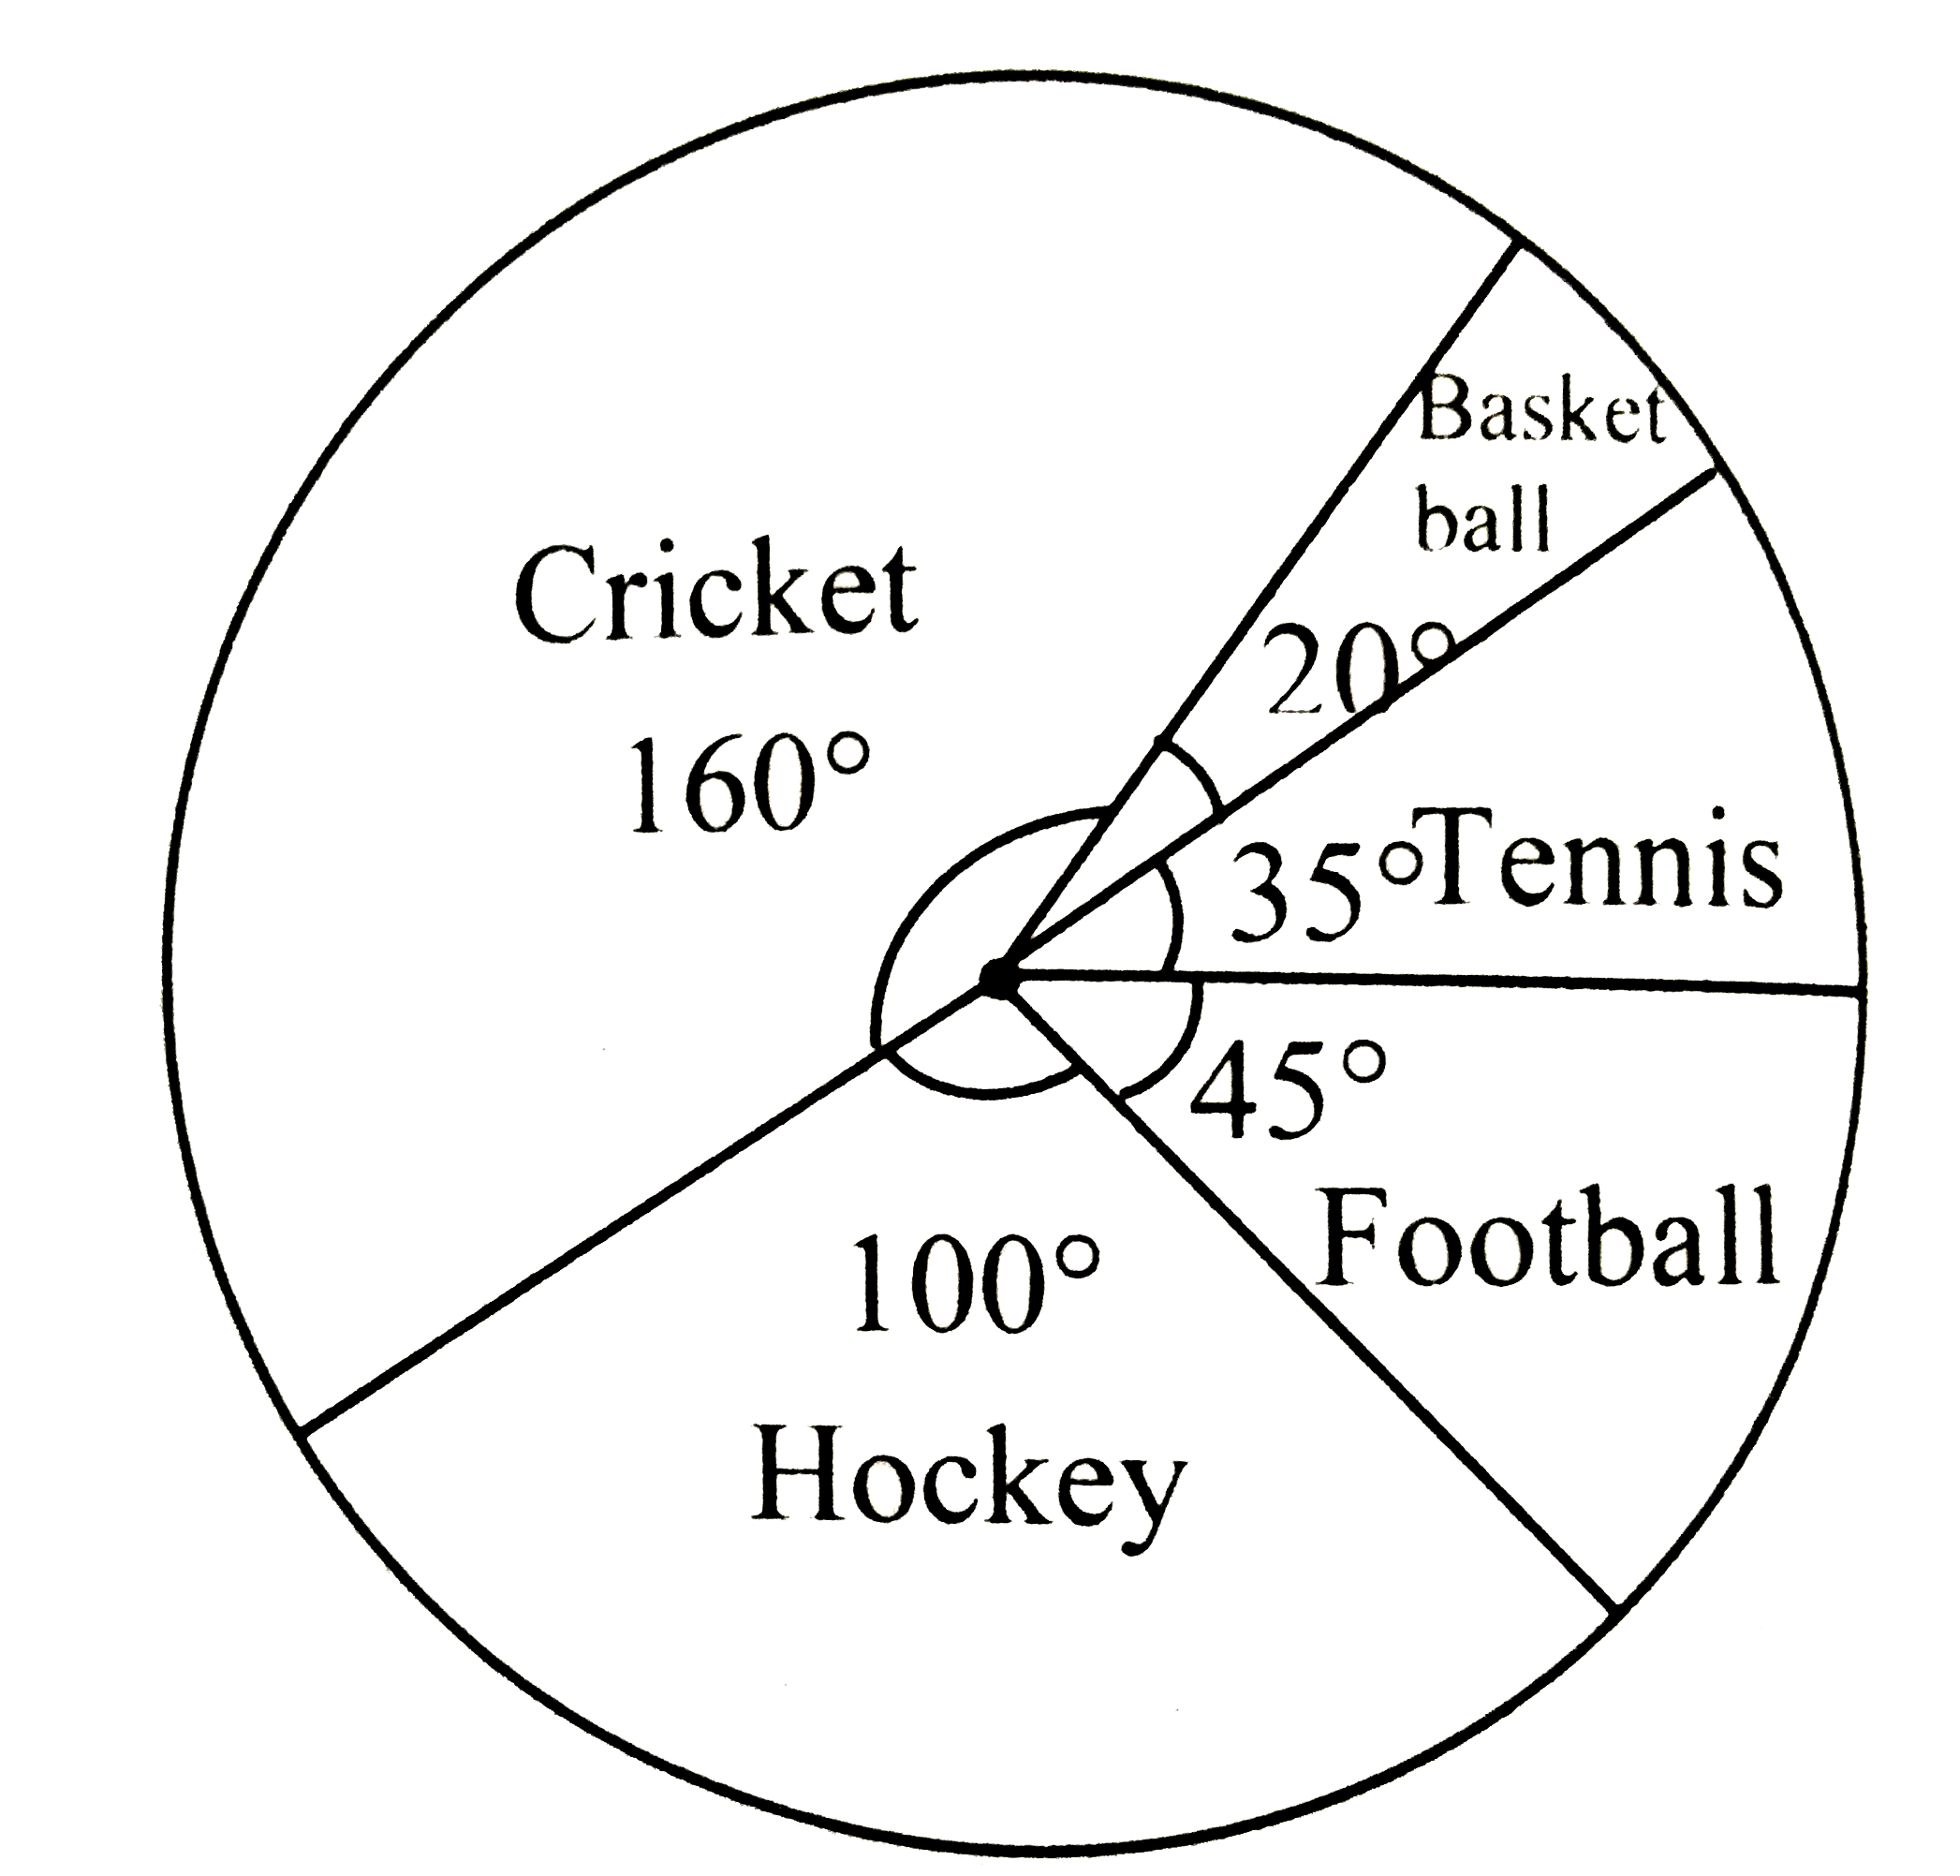
The correct Answer is:i.Rs72000
ii.Rs20000
iii.Rs3000
Step by step video & image solution for The pie diagram represents the amount spent on different sports by a school administration in a year. If the money spent on football is Rs9000, answer the following questions : i. What is the total amount spent on sports? ii. What is the amount spent on hockey? iii. How much more amount is spent on tennis than on basket ball? by Maths experts to help you in doubts & scoring excellent marks in Class 10 exams.
Topper's Solved these Questions
- BOOK - TARGET PUBLICATIONCHAPTER - STATISTICSEXERCISE - Try this2videos
STATISTICS
- BOOK - TARGET PUBLICATIONCHAPTER - STATISTICSEXERCISE - Multiple Choice Questions14videos
STATISTICS
- BOOK - TARGET PUBLICATIONCHAPTER - SIMILARITY EXERCISE - Chapter Assessment19videos
SIMILARITY
- BOOK - TARGET PUBLICATIONCHAPTER - TRIGONOMETRY EXERCISE - Chapter Assessment18videos
TRIGONOMETRY
Similar Questions
Observe the pie diagram.
If the amount spent on football per year is RS 9000, answer the following questions :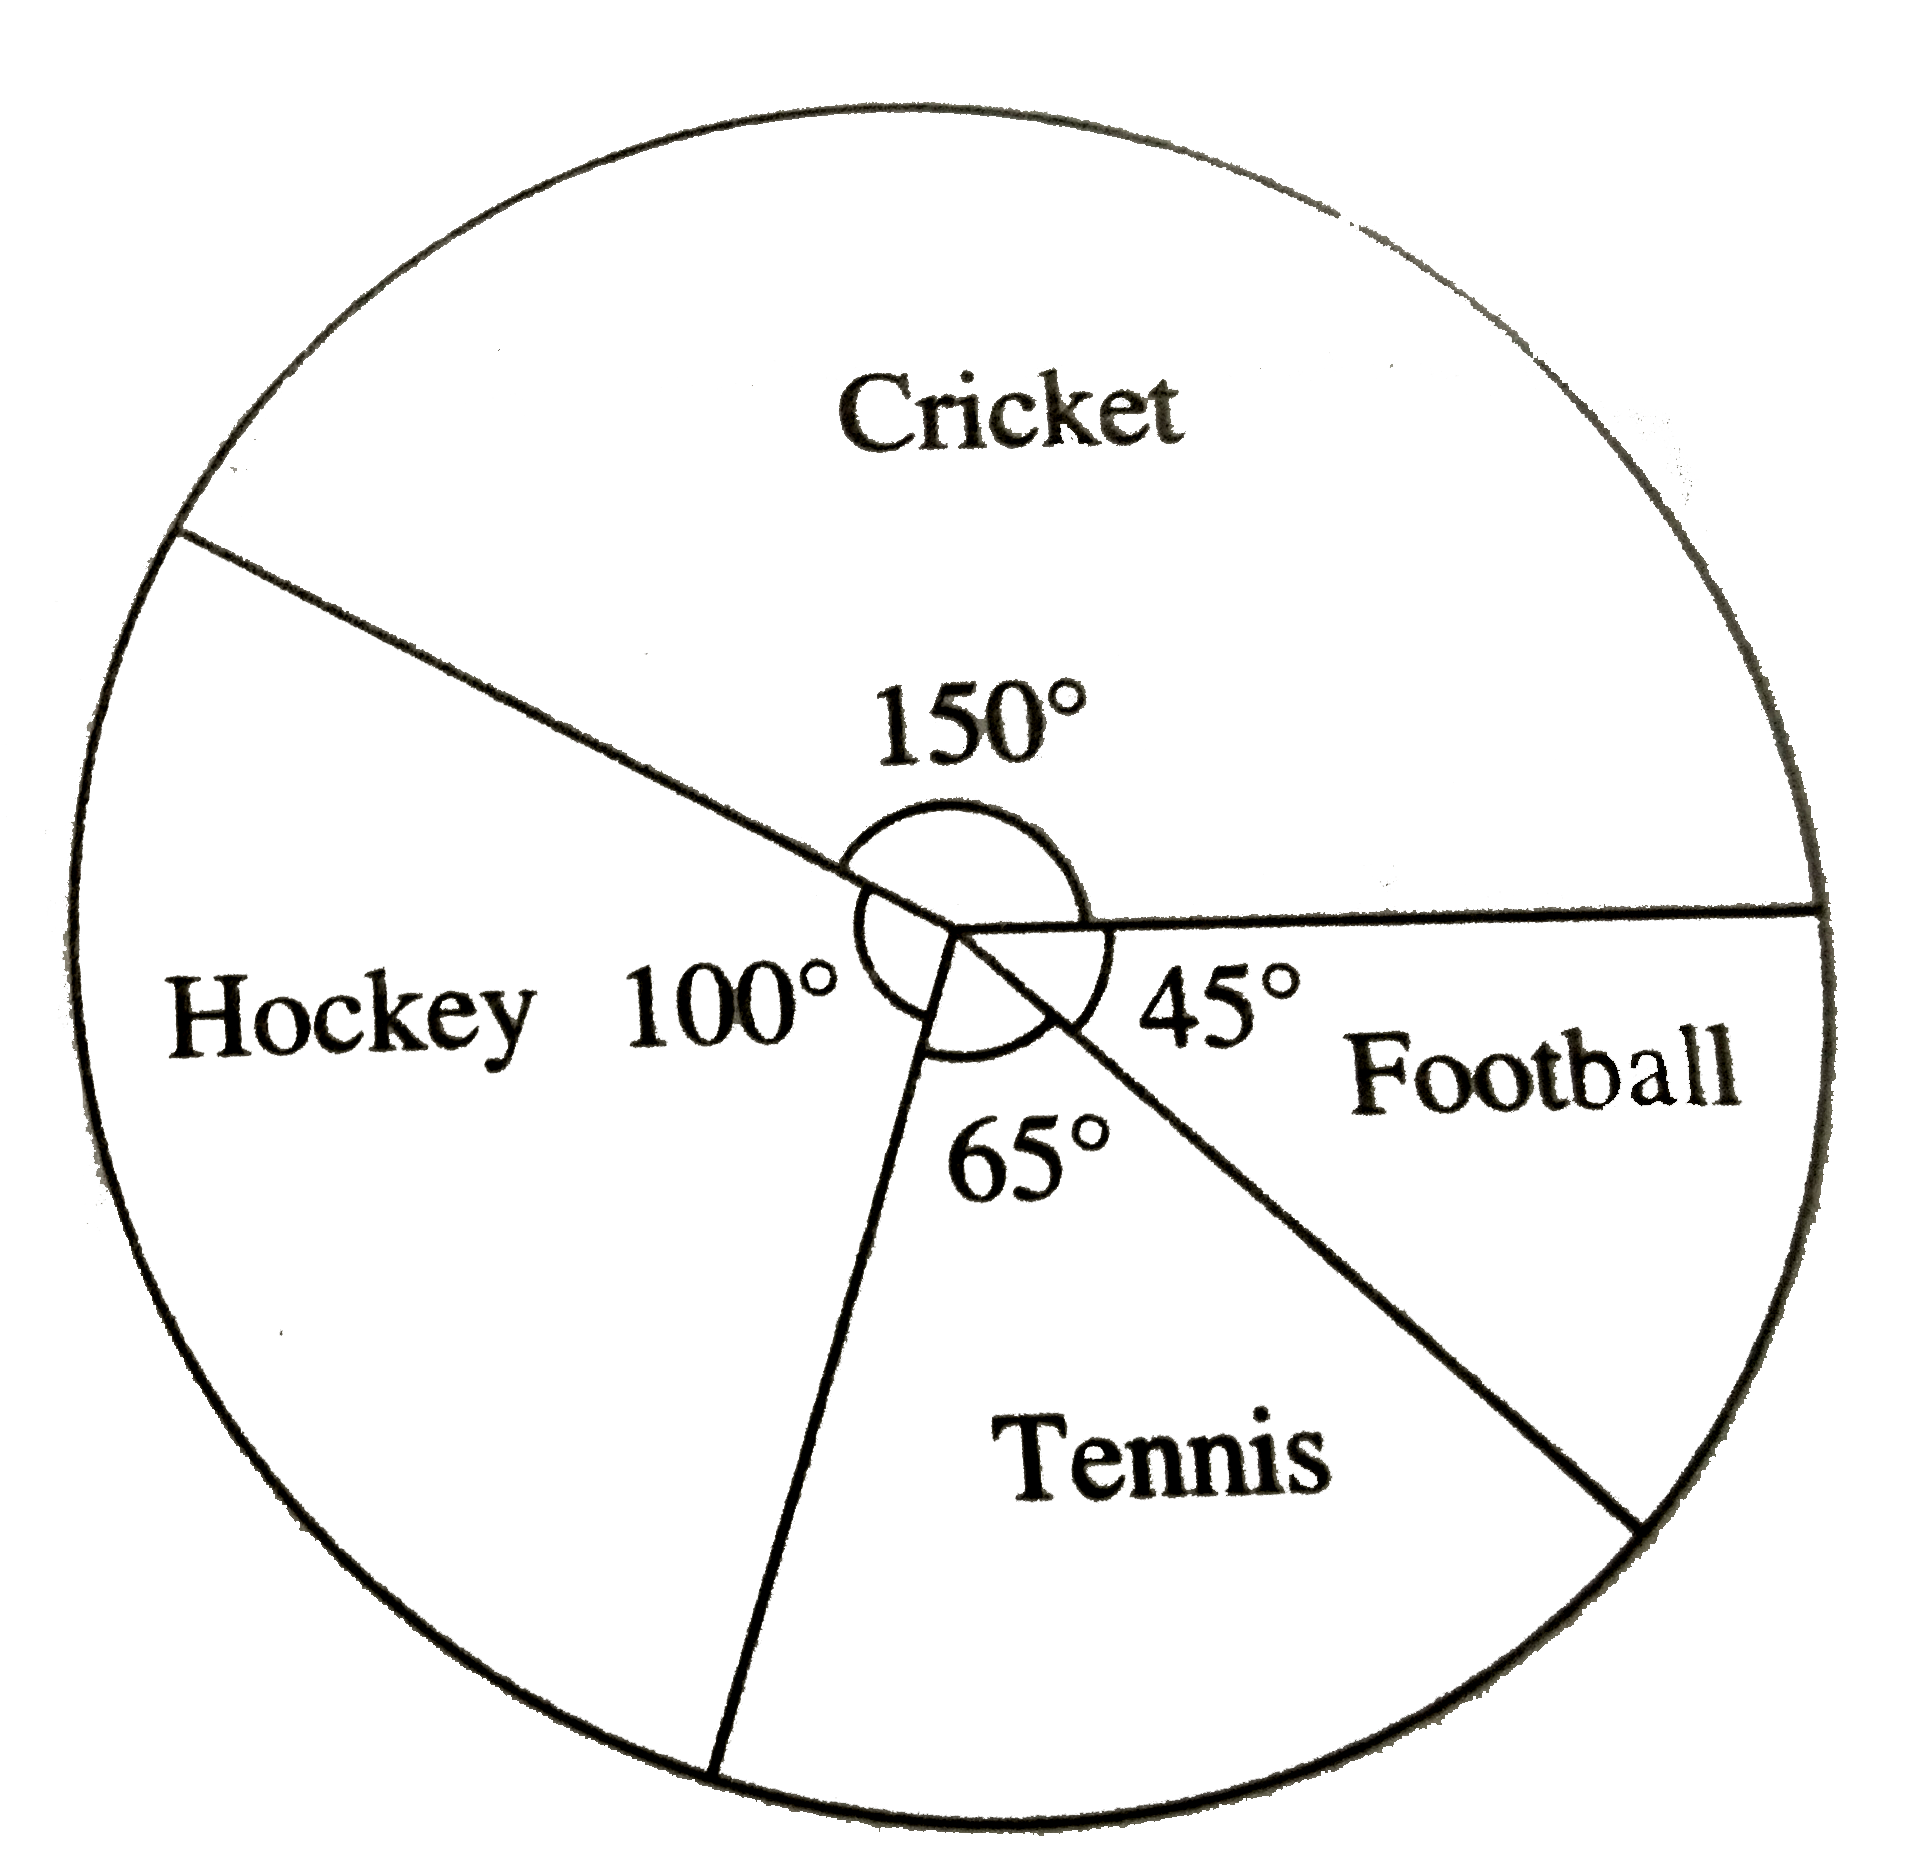
(i) What is the total amount spent on sports?
(ii) What is the amount spent on hockey?View Solution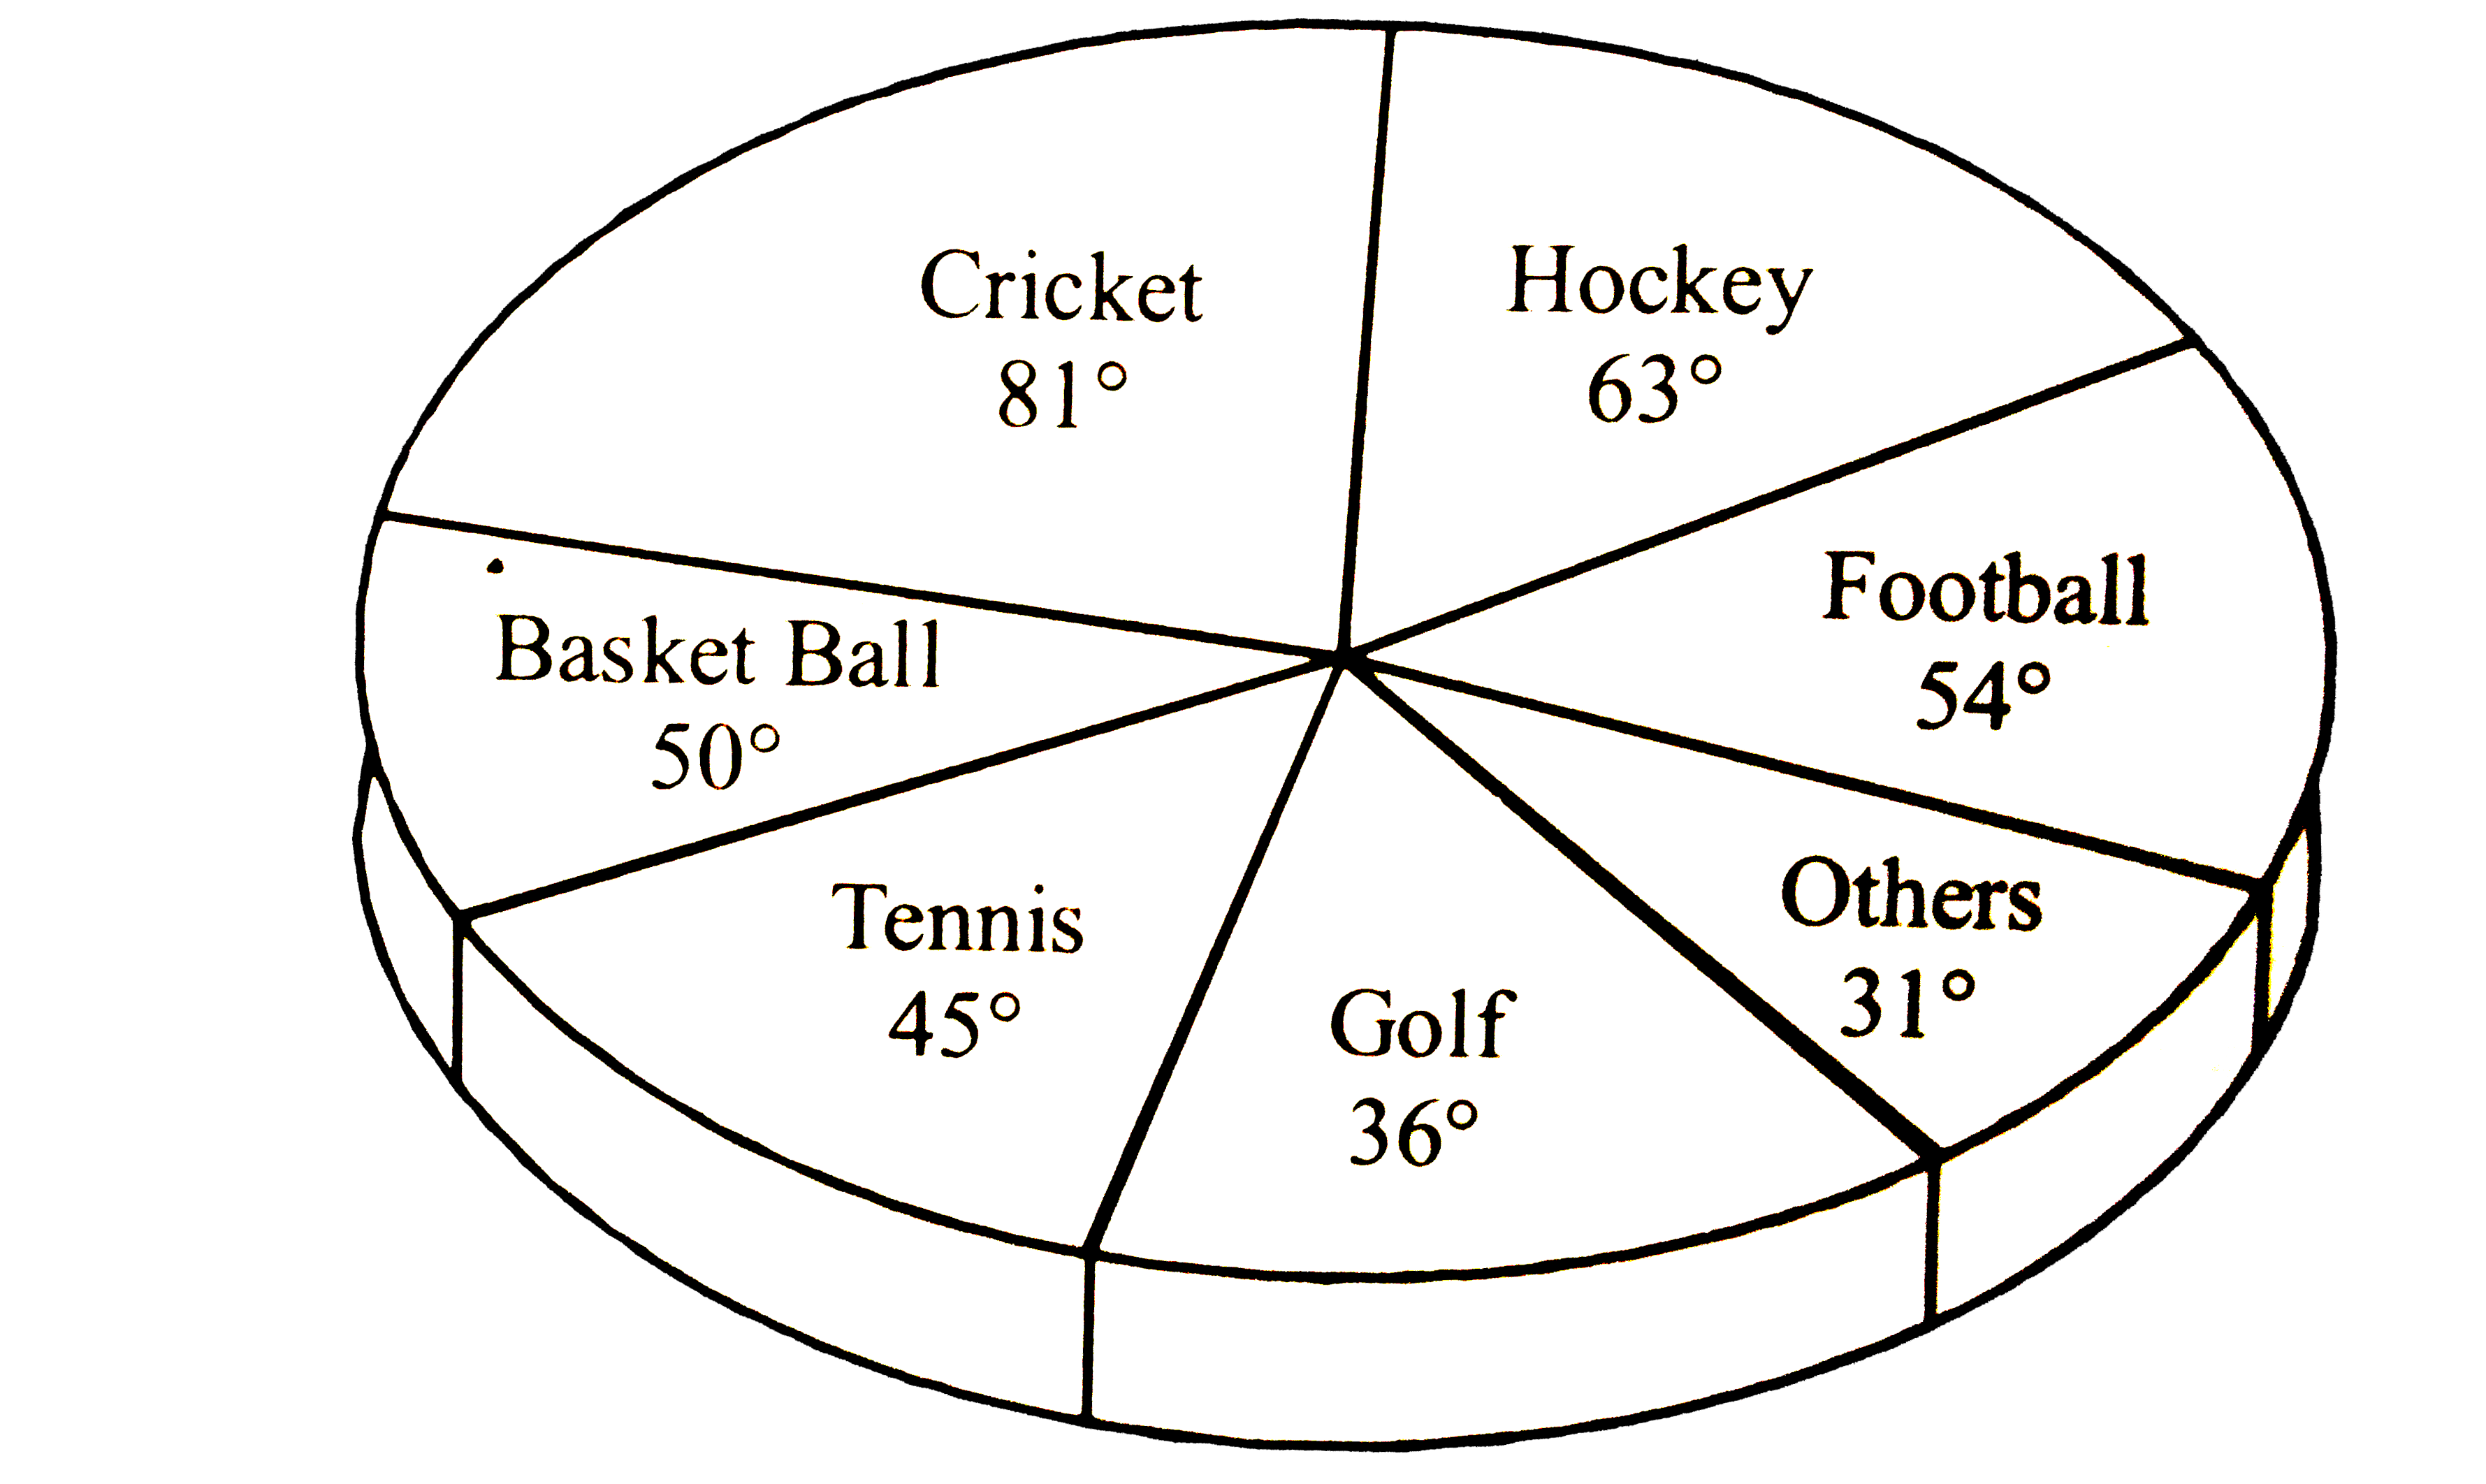
If the total amount spent on sports during the year was Rs. 2 crore, the amount spent on circket hockey together wasView Solution
Knowledge Check
- Question 1 - Select One
The pie-chart below shows percentage of money spent on different sports in a state in a particular year. The total amount spent on all sports is Rs. 150 crore.
Answer the following questins on the basis of data given in the chart below.
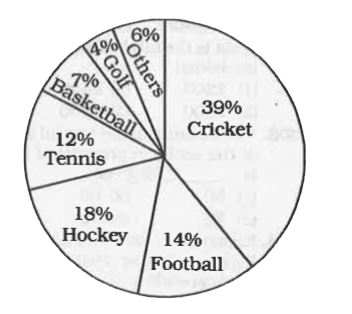
What is the amount of mmoney spent on Cricket and Hockey together?ARs. 57 croreBRs. 82.5 croreCRs. 85.5 croreDRs. 84.5 crore - Question 2 - Select One
The pie-chart below shows percentage of money spent on different sports in a state in a particular year. The total amount spent on all sports is Rs. 150 crore.
Answer the following questins on the basis of data given in the chart below.
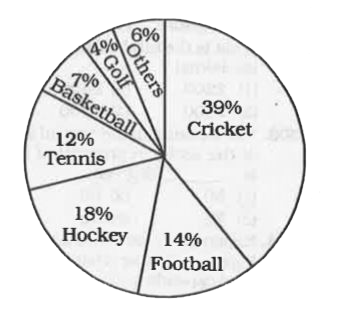
How much more amount is spent on Cricket than the money spent on Hockey and Football together ?ARs. 9 croreBRs. 11.5 croreCRs. 9.5 croreDRs. 10.5 crore - Question 3 - Select One
The pie-chart below shows percentage of money spent on different sports in a state in a particular year. The total amount spent on all sports is Rs. 150 crore.
Answer the following questins on the basis of data given in the chart below.
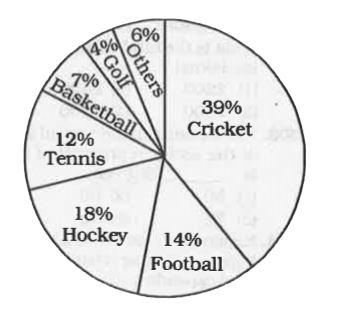
How much more amount is spent on Hockey than that on Football ?ARs. 6 croreBRs. 7.5 croreCRs. 4.5 croreDRs. 6.5 crore
The pie chart, given here, shows the amount of money spent on various sports by a school administration in a particular year.
Observe the pie chart and answer the questions based on this graph
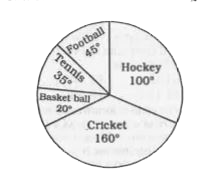
If the money spent on football was Rs. 9,000, what amount was spent on Cricket?View SolutionThe pie chart, given here, shows the amount of money spent on various sports by a school administration in a particular year.
Observe the pie chart and answer the questions based on this graph
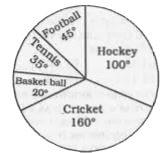
If the money spent on football is Rs. 9,000, then what was the total amount spent on all sports ?View SolutionThe pie chart, given here, shows the amount of money spent on various sports by a school administration in a particular year.
Observe the pie chart and answer the questions based on this graph
If the money spent on football was Rs. 9,000 how much more money was spent on hockey than on football ?View SolutionThe given pie chart shows the amount of money spent by a school on various sports in the year 2015.
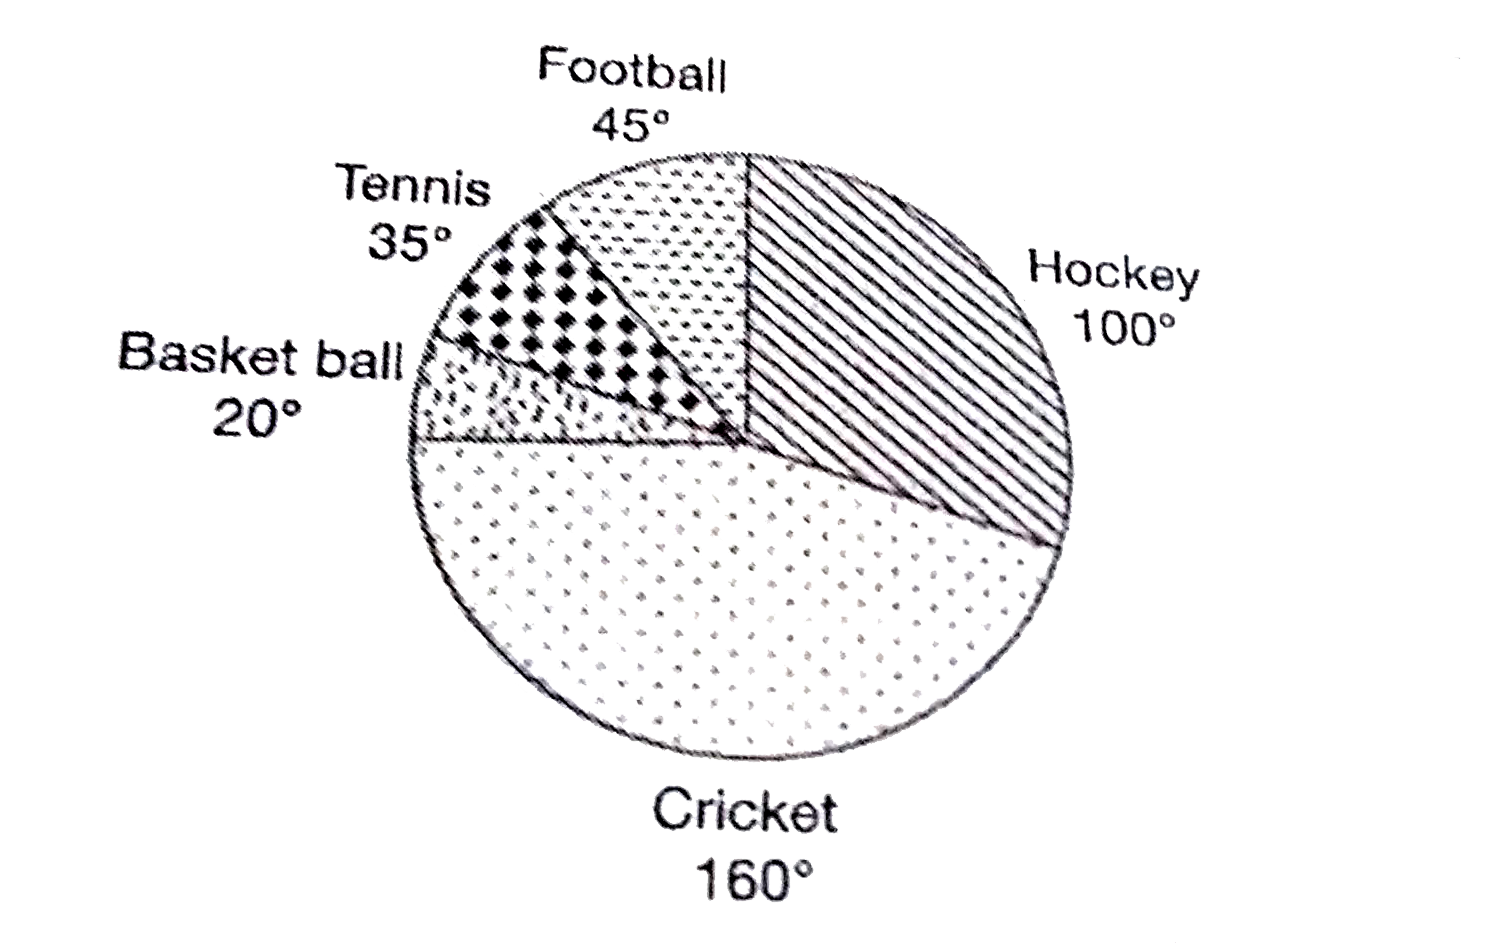
Study the pie chart carefully and answer the following question.
(i) If the amount spent on football was Rs. 9000, then how much more money was spent on hockey than on football ?
(ii) If the amount spent on football Rs. 9000, then what was the total amount spent on all sports ?View SolutionA pie diagram represents the number of hours spent by a school boy in different activites in a day. If 7 hours are spent in school, then what is the measure of the central angle?
View Solution

