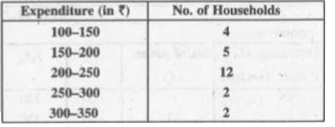
The table below shows the daily expenditure on food of 25 households in a locality :

Find the mean daily expenditure on food by the step-deviation method.Solution in Gujrati
The correct Answer is:₹ 211
Step by step video, text & image solution for The table below shows the daily expenditure on food of 25 households in a locality : Find the mean daily expenditure on food by the step-deviation method. by Maths experts to help you in doubts & scoring excellent marks in Class 10 exams.
Updated on:21/07/2023Topper's Solved these Questions
- STATISTICSBOOK - KUMAR PRAKASHANCHAPTER - STATISTICSEXERCISE - Exercise 14.2
6 Videos
- STATISTICSBOOK - KUMAR PRAKASHANCHAPTER - STATISTICSEXERCISE - Exercise 14.3
7 Videos
- STATISTICSBOOK - KUMAR PRAKASHANCHAPTER - STATISTICSEXERCISE - Other Important Examples
9 Videos
- SOME AAPLICATIONS OF TRIGONOMETRYBOOK - KUMAR PRAKASHANCHAPTER - SOME AAPLICATIONS OF TRIGONOMETRYEXERCISE - Objective Questions
24 Videos
- SURFACE AREAS AND VOLUMESBOOK - KUMAR PRAKASHANCHAPTER - SURFACE AREAS AND VOLUMESEXERCISE - TEST YOUR SKILLS
5 Videos
Similar Questions
The following table shows the ages of the patients admitted in a hospital during a year :
Age (in years) 5−1515−2525−3535−4545−5555−65Number of patients 6 11 21 23 14 5
Find the mode the mean of the data given above. Compare and interpret the two measures of central tendency.
View SolutionThe following frequency distribution gives the monthly consumption of electricity of 68 consumers of a locality . Find the median, mean and mode of the data and compare them .
Monthly consumption (in units) Number of consumers 65−85 4 85−105 5 105−125 13 125−145 20 145−165 14 165−185 8 185−205 4
View SolutionThe marks obtained by 100 students of two classes in mathematics paper consisting of 100 marks are as follows :
Marks obtained (xi)15202532354550607077808590929599 Number of students (fi)2374101298681194232
Find the mean of the marks obtained by the students directly. Then , classify the data with classes of equal length as 10-25, 25-40, . . . . 85-100 and find the mean by all the three methods.
View SolutionA kite is flying at a height of 75m from the level ground, attached to a taut string inclined at 60∘ to the horizontal. Then, the length of the string is …………m
View SolutionThe slant height of a frustum of a cone is 4 m and the perimeter of circular ends are 18 m and 16 m. Find the cost of painting its curved surface at 10 per sq. m.
View SolutionThe table below shows the daily expenditure on food of 25 households in a locality.Find the mean daily expenditure on food by a suitable method.
View SolutionThe table below shows the daily expenditure on food of 30 households in a locality:

Find the mean and median daily expenditure on food.
View SolutionMatch the following Column A to Column B

View SolutionThe inequation represented by the graph given below is :
View SolutionThe inequation that best describes the graph given below is _________
View Solutionनिम्नलिखित सारणी किसी मोहल्ले के 25 परिवारों में भोजन पर हुए दैनिक व्यय को दर्शाती है: एक उपयुक्त विधि द्वारा भोजन पर हुआ माध्य व्यय ज्ञात कीजिए।

View Solutionनिम्नलिखित सारणी किसी मोहल्ले के परिवारों में भोजन पर हुए दैनिक व्यय को दर्शाती है :
एक उपयुक्त विधि द्वारा भोजन पर हुआ माध्य व्यय ज्ञात कीजिए ।

View SolutionThe table below shows the daily expenditure on food of 25 households in a locality .
Daily expenditure (Rs)Number of households100−1504150−2005200−25012250−3002300−3502 Find the mean of expenditure on food of households in a locality .
View SolutionThe table below shows the daily expenditure on food of 25 households in a locality.

Find the mean daily expenditure on food by a suitable method.
View SolutionThe table below shows daily expenditure on food of 25 households in a locality.
Find the mean daily expenditure.

View SolutionThe table below shows the daily expenditure on food of 25 households in a locality.
Dail expenditure (in Rs)100−150150−200200−250250−300300−350Number of households451222
Find the mean daily expenditure on food by suitable method.
View Solution
