The table below shows the daily expenditure on food of 25 households in a locality.Find the mean daily expenditure on food by a suitable method.
To find the mean daily expenditure on food of 25 households using the direct method, we will follow these steps:
Step 1: Create a Frequency Table
First, we need to organize the data into a frequency table. The table will include the expenditure ranges, the number of households in each range, and the midpoints (xi) of each range.
| Daily Expenditure (Range) | Number of Households (fi) | Midpoint (xi) |
|---------------------------|---------------------------|----------------|
| 100 - 150 | 4 | 125 |
| 150 - 200 | 5 | 175 |
| 200 - 250 | 12 | 225 |
| 250 - 300 | 2 | 275 |
| 300 - 350 | 2 | 325 |
Step 2: Calculate the Midpoints (xi)
The midpoint for each range is calculated using the formula:
xi=Lower limit+Upper limit2
- For the range 100 - 150:
xi=100+1502=125
- For the range 150 - 200:
xi=150+2002=175
- For the range 200 - 250:
xi=200+2502=225
- For the range 250 - 300:
xi=250+3002=275
- For the range 300 - 350:
xi=300+3502=325
Step 3: Calculate fi * xi
Next, we multiply the number of households (fi) by the midpoint (xi) for each range to get fi * xi.
| Daily Expenditure (Range) | Number of Households (fi) | Midpoint (xi) | fi * xi |
|---------------------------|---------------------------|----------------|---------|
| 100 - 150 | 4 | 125 | 500 |
| 150 - 200 | 5 | 175 | 875 |
| 200 - 250 | 12 | 225 | 2700 |
| 250 - 300 | 2 | 275 | 550 |
| 300 - 350 | 2 | 325 | 650 |
Step 4: Sum of fi and Sum of fi * xi
Now, we need to calculate the total of fi and the total of fi * xi.
- Total of fi:
Total fi=4+5+12+2+2=25
- Total of fi * xi:
Total (fi∗xi)=500+875+2700+550+650=4275
Step 5: Calculate the Mean
Finally, we can find the mean daily expenditure using the formula:
Mean=∑(fi∗xi)∑fi
Substituting the values we calculated:
Mean=427525=171
Final Answer
The mean daily expenditure on food by the households is 171.
---
First, we need to organize the data into a frequency table. The table will include the expenditure ranges, the number of households in each range, and the midpoints (xi) of each range.
|---------------------------|---------------------------|----------------|
| 100 - 150 | 4 | 125 |
| 150 - 200 | 5 | 175 |
| 200 - 250 | 12 | 225 |
| 250 - 300 | 2 | 275 |
| 300 - 350 | 2 | 325 |
The midpoint for each range is calculated using the formula:
xi=Lower limit+Upper limit2
xi=100+1502=125
- For the range 150 - 200:
xi=150+2002=175
- For the range 200 - 250:
xi=200+2502=225
- For the range 250 - 300:
xi=250+3002=275
- For the range 300 - 350:
xi=300+3502=325
Next, we multiply the number of households (fi) by the midpoint (xi) for each range to get fi * xi.
|---------------------------|---------------------------|----------------|---------|
| 100 - 150 | 4 | 125 | 500 |
| 150 - 200 | 5 | 175 | 875 |
| 200 - 250 | 12 | 225 | 2700 |
| 250 - 300 | 2 | 275 | 550 |
| 300 - 350 | 2 | 325 | 650 |
Now, we need to calculate the total of fi and the total of fi * xi.
Total fi=4+5+12+2+2=25
Total (fi∗xi)=500+875+2700+550+650=4275
Finally, we can find the mean daily expenditure using the formula:
Mean=∑(fi∗xi)∑fi
Mean=427525=171
The mean daily expenditure on food by the households is 171.
Similar Questions
The table below shows the daily expenditure on food of 30 households in a locality:

Find the mean daily expenditure on food.View SolutionThe table below shows the daily expenditure on food of 25 households in a locality. daily expenditure(in rs) 100-150 150-200 200-250 250-300 300-350 no. of households 4 5 12 2 2 Find the mean daily expenditure on food by a suitable method.
View SolutionIn the following table, the total expenditure of the labourers of a city is given Find the average expenditure by deviation method.
View SolutionThe table shows the marks obtained by 25 students in a class test. Find the mean of the marks obtained
 View Solution
The following table shows the expenditure of 60 boys on books. Find the mode of their expenditure:
View SolutionThe following table given the daily income of 50 workers of a factory :

Find the mean of above data.View SolutionFind the mean from the following table using short cut method. :
 View Solution
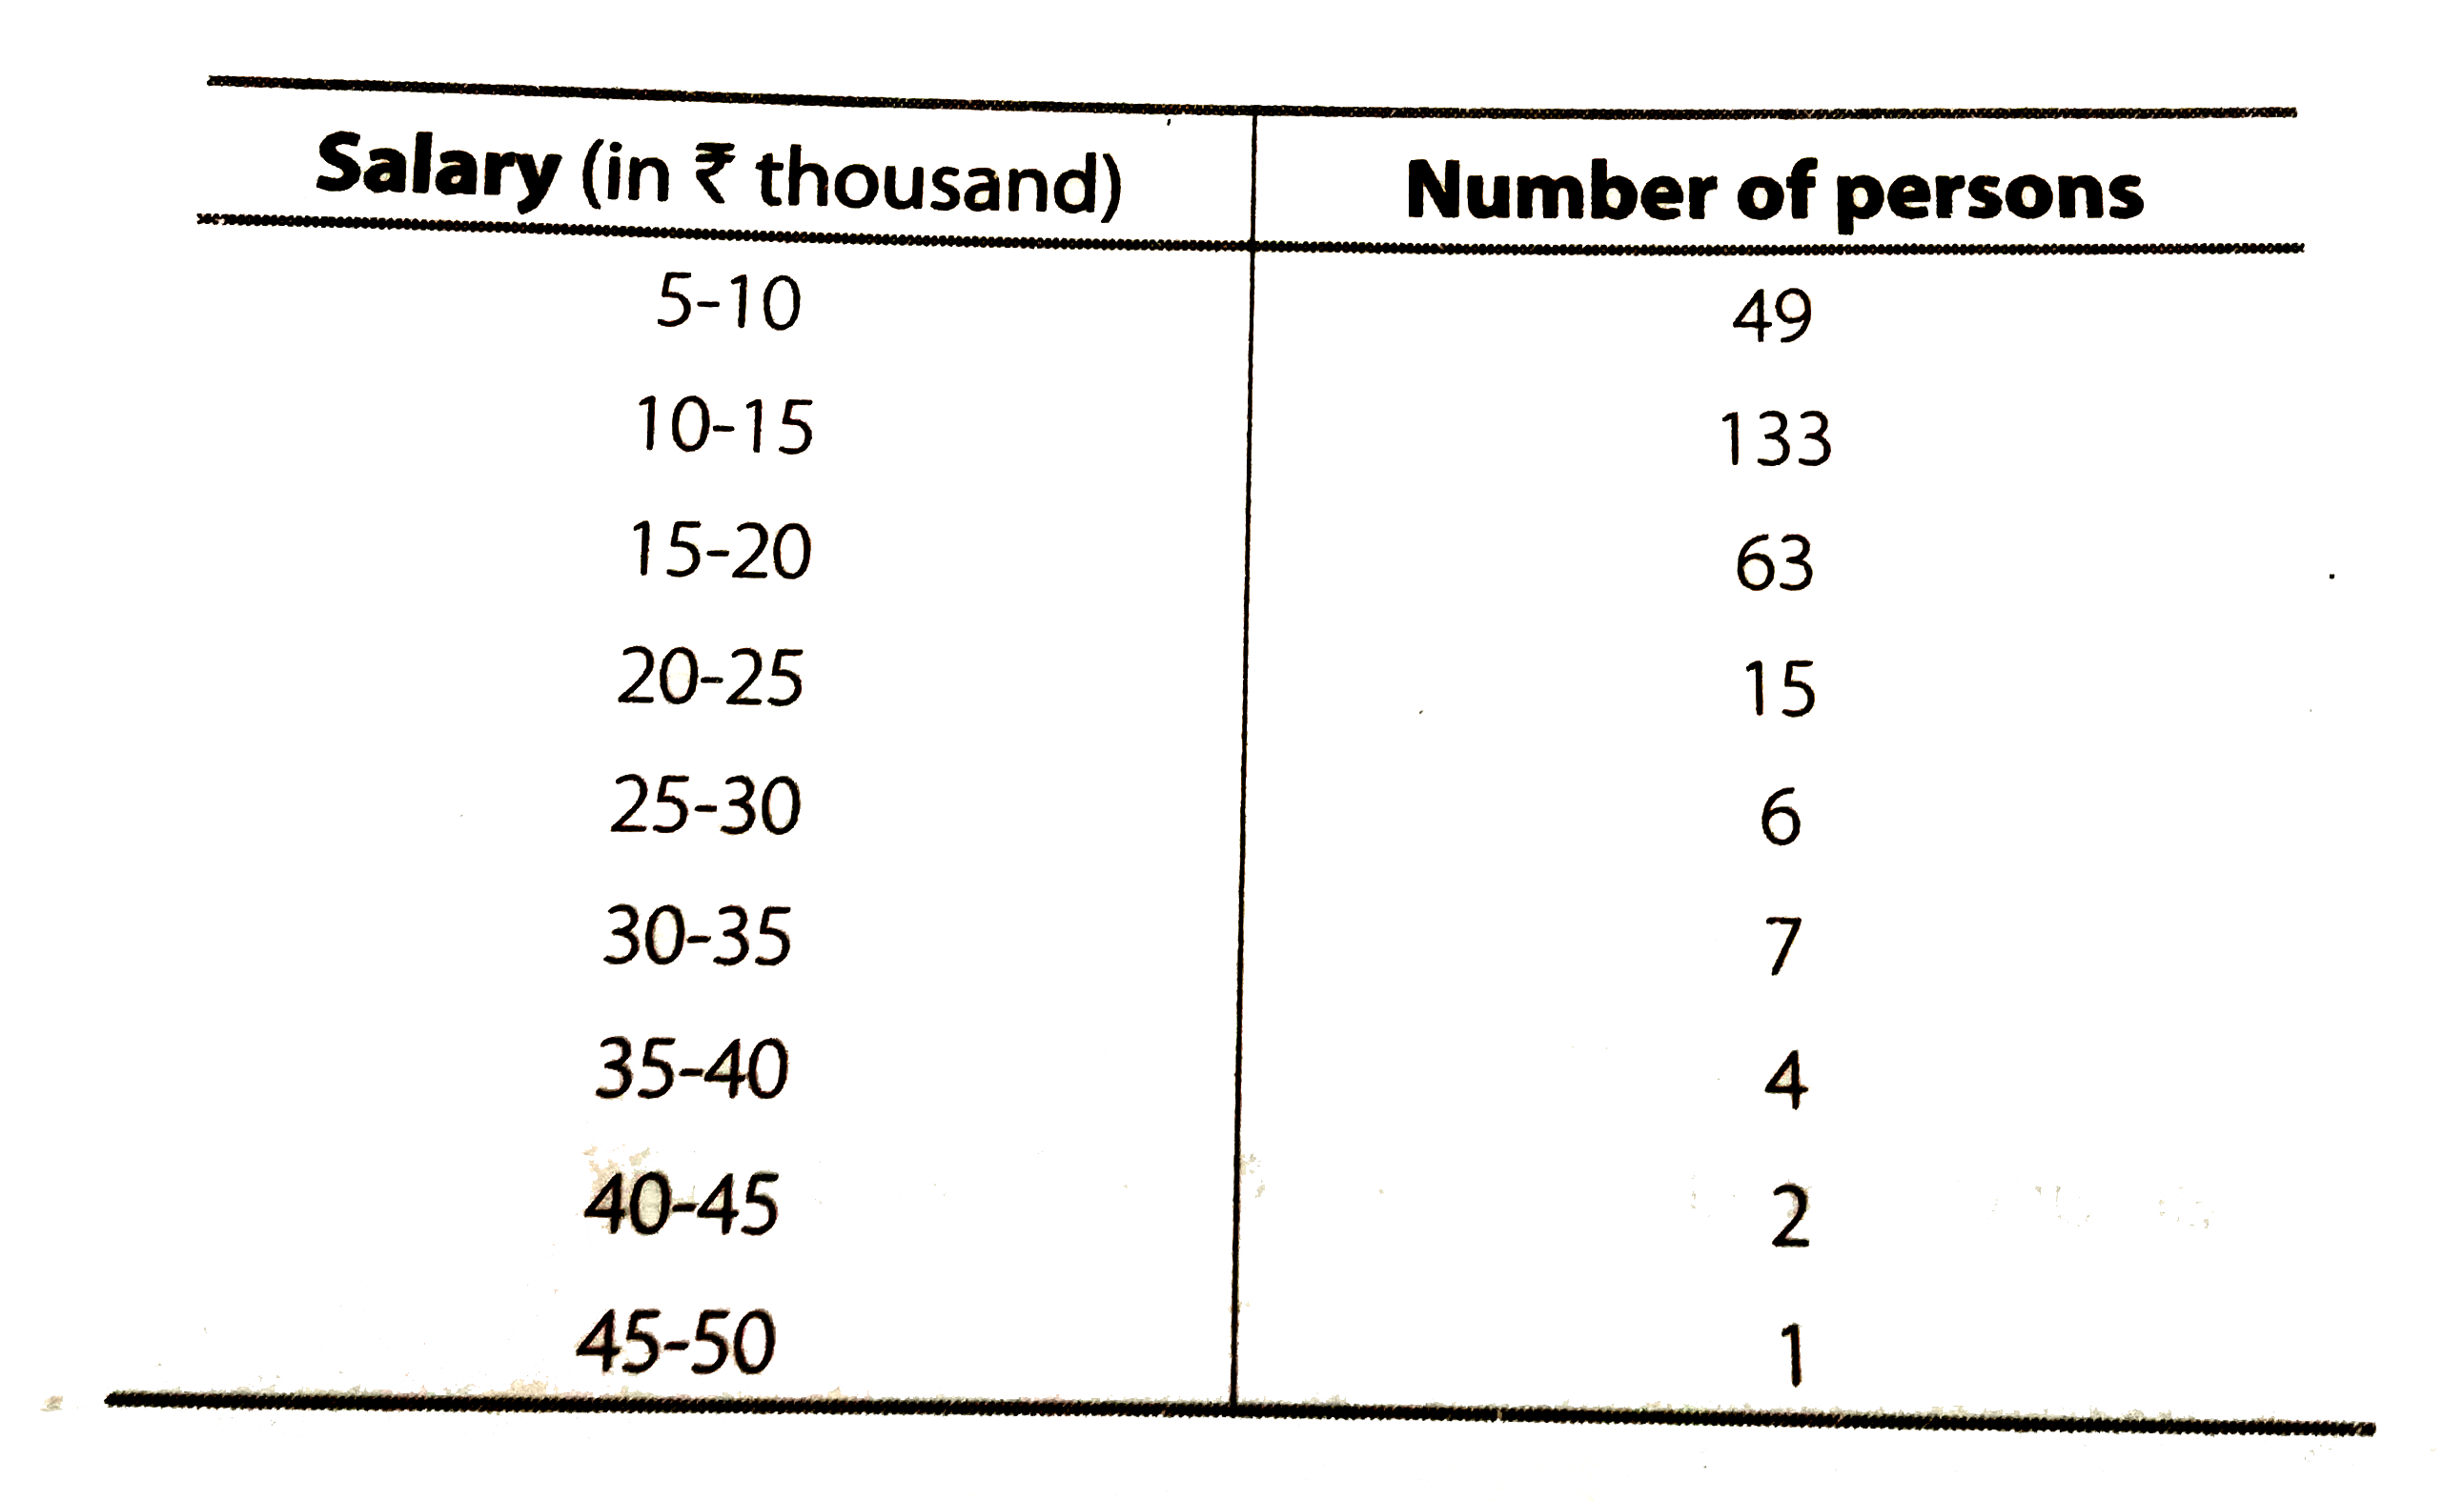
The table below shows the salaries of 280 persons.
 Find the median salary of the given data
View Solution
Find the median salary of the given data
View SolutionThe distribution below shows the number of wickets taken by bowlers in one-day cricket matches. Find the mean number of wickets by choosing a suitable method. What does the mean signify?
View SolutionFind the mean of the following table by step deviation method :
 View Solution

