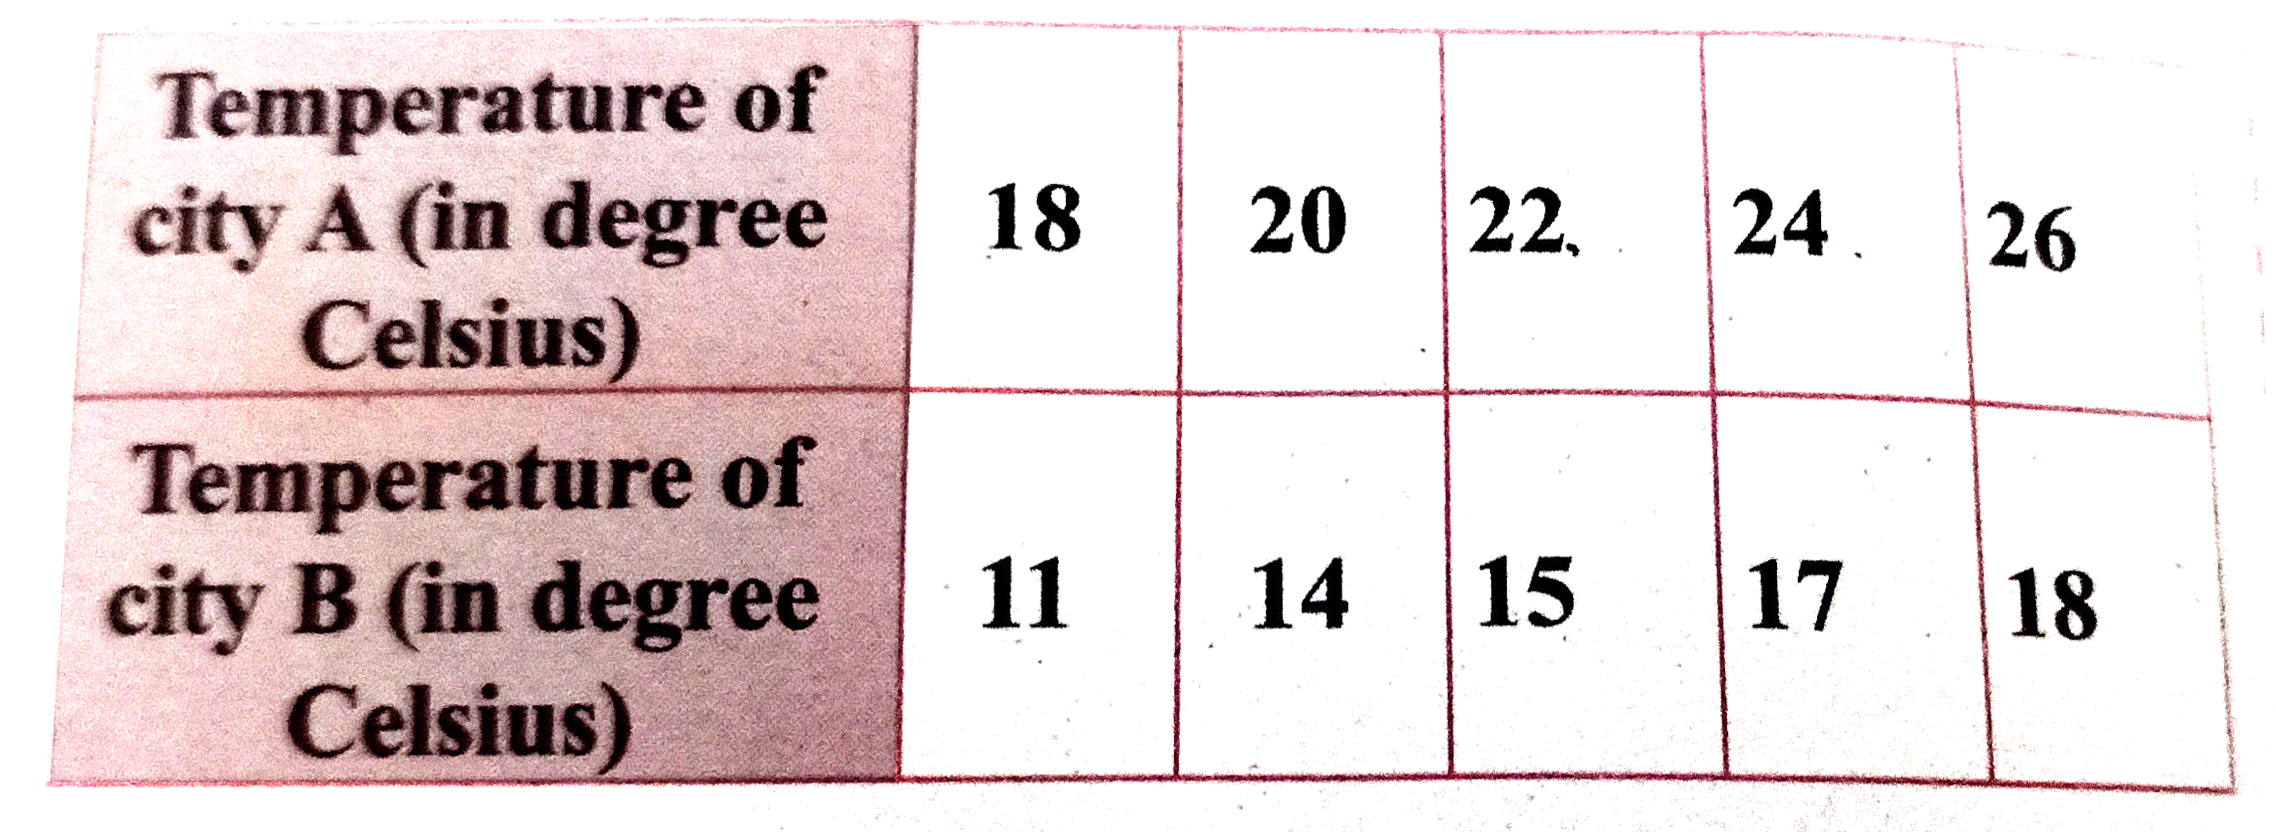
The temperature of two cities A and B in a winter season are given below.

Find which city is more consistent in temperature changes ?Solution in Tamil
The correct Answer is:0.1286
Step by step video, text & image solution for The temperature of two cities A and B in a winter season are given below. Find which city is more consistent in temperature changes ? by Maths experts to help you in doubts & scoring excellent marks in Class 10 exams.
Updated on:21/07/2023Topper's Solved these Questions
- STATISTICS AND PROBABILITY BOOK - PREMIERS PUBLISHERSCHAPTER - STATISTICS AND PROBABILITY EXERCISE - SOLUTION TO EXERCISE 8.3
33 Videos
- STATISTICS AND PROBABILITY BOOK - PREMIERS PUBLISHERSCHAPTER - STATISTICS AND PROBABILITY EXERCISE - SOLUTION TO EXERCISE 8.4
18 Videos
- STATISTICS AND PROBABILITY BOOK - PREMIERS PUBLISHERSCHAPTER - STATISTICS AND PROBABILITY EXERCISE - OTHER IMPORTANT OBJECTIVE TYPE QUESTIONS
23 Videos
- RELATIONS AND FUNCTION BOOK - PREMIERS PUBLISHERSCHAPTER - RELATIONS AND FUNCTION EXERCISE - OTHER IMPORTANT OBJECTIVE TYPE QUESTIONS
25 Videos
- TRIGONOMETRYBOOK - PREMIERS PUBLISHERSCHAPTER - TRIGONOMETRYEXERCISE - OTHER IMPORTANT OBJECTIVE TYPE QUESTIONS
22 Videos
Similar Questions
Write the sample space for tossing three coins using tree diagram.
View SolutionIf P(A)=23,P(B)=25,P(A∪B)=13 then find P(A∩B)
View SolutionIf the sum and mean of the data are 418 and 11 respectively then the no. of observation is the data is:
View SolutionIf n(A×B)=24andA={1,3,5,7}then n (B) is
View Solutionsec(90∘−θ)= ………………
View SolutionWhich of the following are correct chain isomers of butane ? (i)
View SolutionDetermine the point of symmetry of a regular hexagon.
View SolutionDtermine the images of the following figure about the given line :
View SolutionMatch the following Column A to Column B

View SolutionMatch the following Column A to Column B

View SolutionMatch the following Column A to Column B

View SolutionFind the area of figure given below.

View SolutionFind the perimeter of the figure given below.

View SolutionFind the area of the figure given below.

View SolutionThe area of the shaded part in the figure given below is ______.

View SolutionThe inequation represented by the graph given below is :
View Solution
