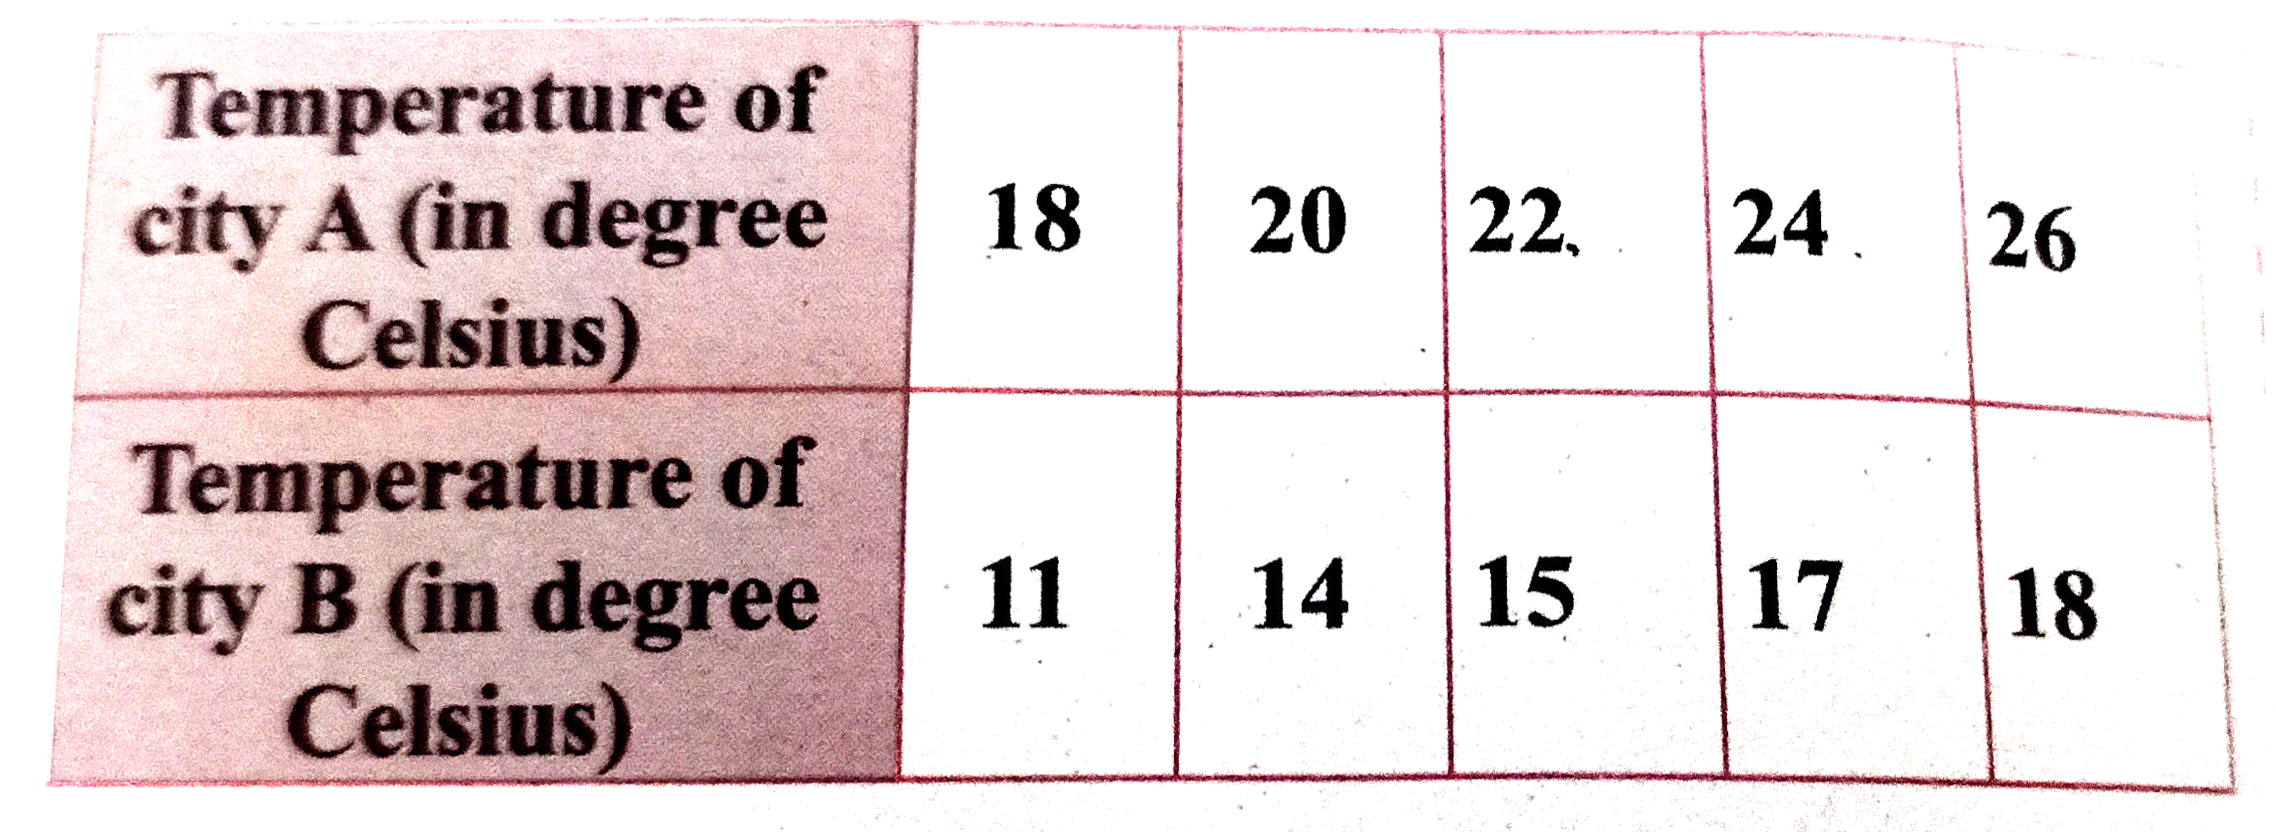
The temperature of two cities A and B in a winter season are given below.

Find which city is more consistent in temperature changes ?Solution in Tamil
The correct Answer is:(i)12.86%
(ii)16.33%
Step by step video, text & image solution for The temperature of two cities A and B in a winter season are given below. Find which city is more consistent in temperature changes ? by Maths experts to help you in doubts & scoring excellent marks in Class 10 exams.
Updated on:21/07/2023Topper's Solved these Questions
- STATISTICS AND PROBABILITYBOOK - FULL MARKSCHAPTER - STATISTICS AND PROBABILITYEXERCISE - Exercise 8.3
15 Videos
- STATISTICS AND PROBABILITYBOOK - FULL MARKSCHAPTER - STATISTICS AND PROBABILITYEXERCISE - Exercise 8.4
14 Videos
- STATISTICS AND PROBABILITYBOOK - FULL MARKSCHAPTER - STATISTICS AND PROBABILITYEXERCISE - Exercise 8.1
15 Videos
- SOLVED PAPER 08 (UNSOLVED)BOOK - FULL MARKSCHAPTER - SOLVED PAPER 08 (UNSOLVED)EXERCISE - Part-IV
3 Videos
- TRIGONOMETRYBOOK - FULL MARKSCHAPTER - TRIGONOMETRYEXERCISE - ADDITIONAL QUESTIONS SOLVED (III)
17 Videos
Similar Questions
Write the sample space for tossing three coins using tree diagram.
View SolutionIf P(A)=23,P(B)=25,P(A∪B)=13 then find P(A∩B)
View SolutionFind the range and coefficient of range of the following data.
(i) 63,89,98,125,79,108,117,68
(ii) 43.5,13.6,18.9,38.4,61.4,29.8
View SolutionConstruct a triangle similar to a given triangle LMN with its sides equal to 45 of the corresponding sides of the triangle LMN (scale factor 45).
View SolutionProve that √secθ−1secθ+1+√secθ+1secθ−1=2cosecθ
View SolutionWhich of the following are correct chain isomers of butane ? (i)
View SolutionDetermine the point of symmetry of a regular hexagon.
View SolutionDtermine the images of the following figure about the given line :
View SolutionMatch the following Column A to Column B

View SolutionMatch the following Column A to Column B

View SolutionMatch the following Column A to Column B

View SolutionFind the area of figure given below.

View SolutionFind the perimeter of the figure given below.

View SolutionFind the area of the figure given below.

View SolutionThe area of the shaded part in the figure given below is ______.

View SolutionThe inequation represented by the graph given below is :
View Solution
