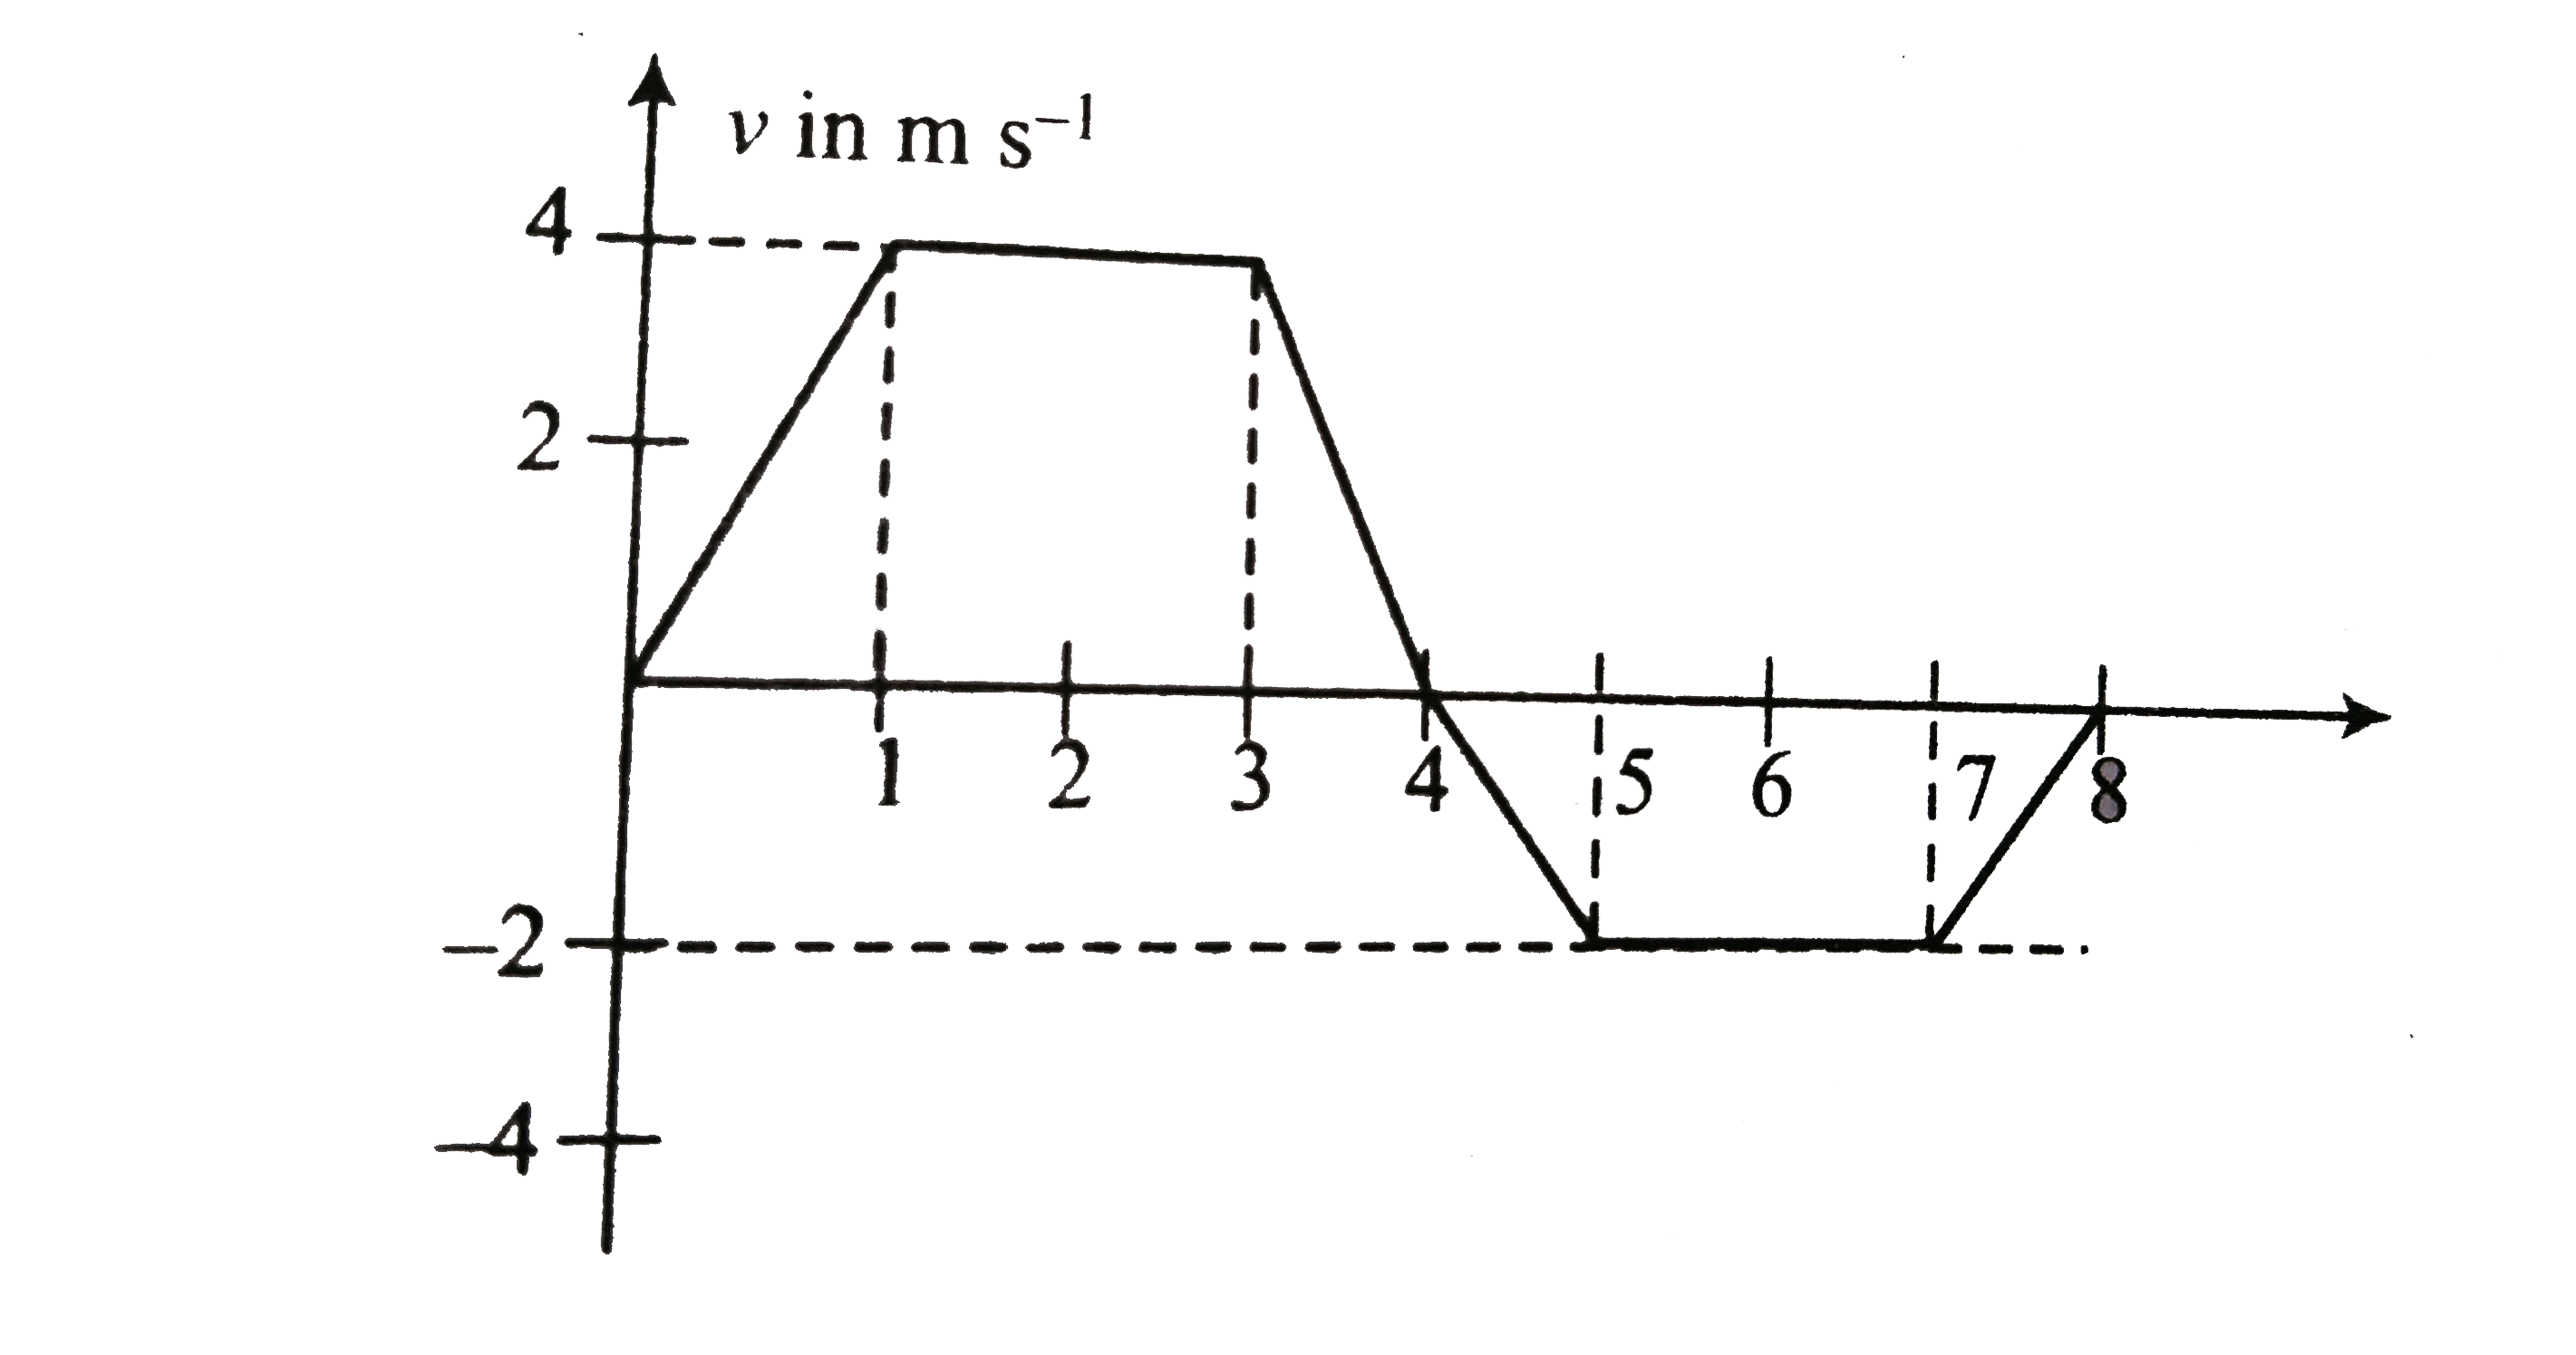
The velocity-time graph of a particle in straight line motion is velocity-time graph of a particle in straight line motion is shown in. The particle starts its motion from origin.
 .
.
The distance of the particle from the origin after 8s is .
18m
16m
8m
6m
The correct Answer is:a
Distance covered=area of speed-time graph
=12×(45+2)×4+12(4+2)×2=18m.
Topper's Solved these Questions
- KINEMATICS-1BOOK - CENGAGE PHYSICS ENGLISHCHAPTER - KINEMATICS-1EXERCISE - Integer
9 Videos
- KINEMATICS-1BOOK - CENGAGE PHYSICS ENGLISHCHAPTER - KINEMATICS-1EXERCISE - Assertion-reasoning
5 Videos
- GRAVITATIONBOOK - CENGAGE PHYSICS ENGLISHCHAPTER - GRAVITATIONEXERCISE - INTEGER_TYPE
1 Videos
- KINEMATICS-2BOOK - CENGAGE PHYSICS ENGLISHCHAPTER - KINEMATICS-2EXERCISE - Exercise Integer
9 Videos
Similar Questions
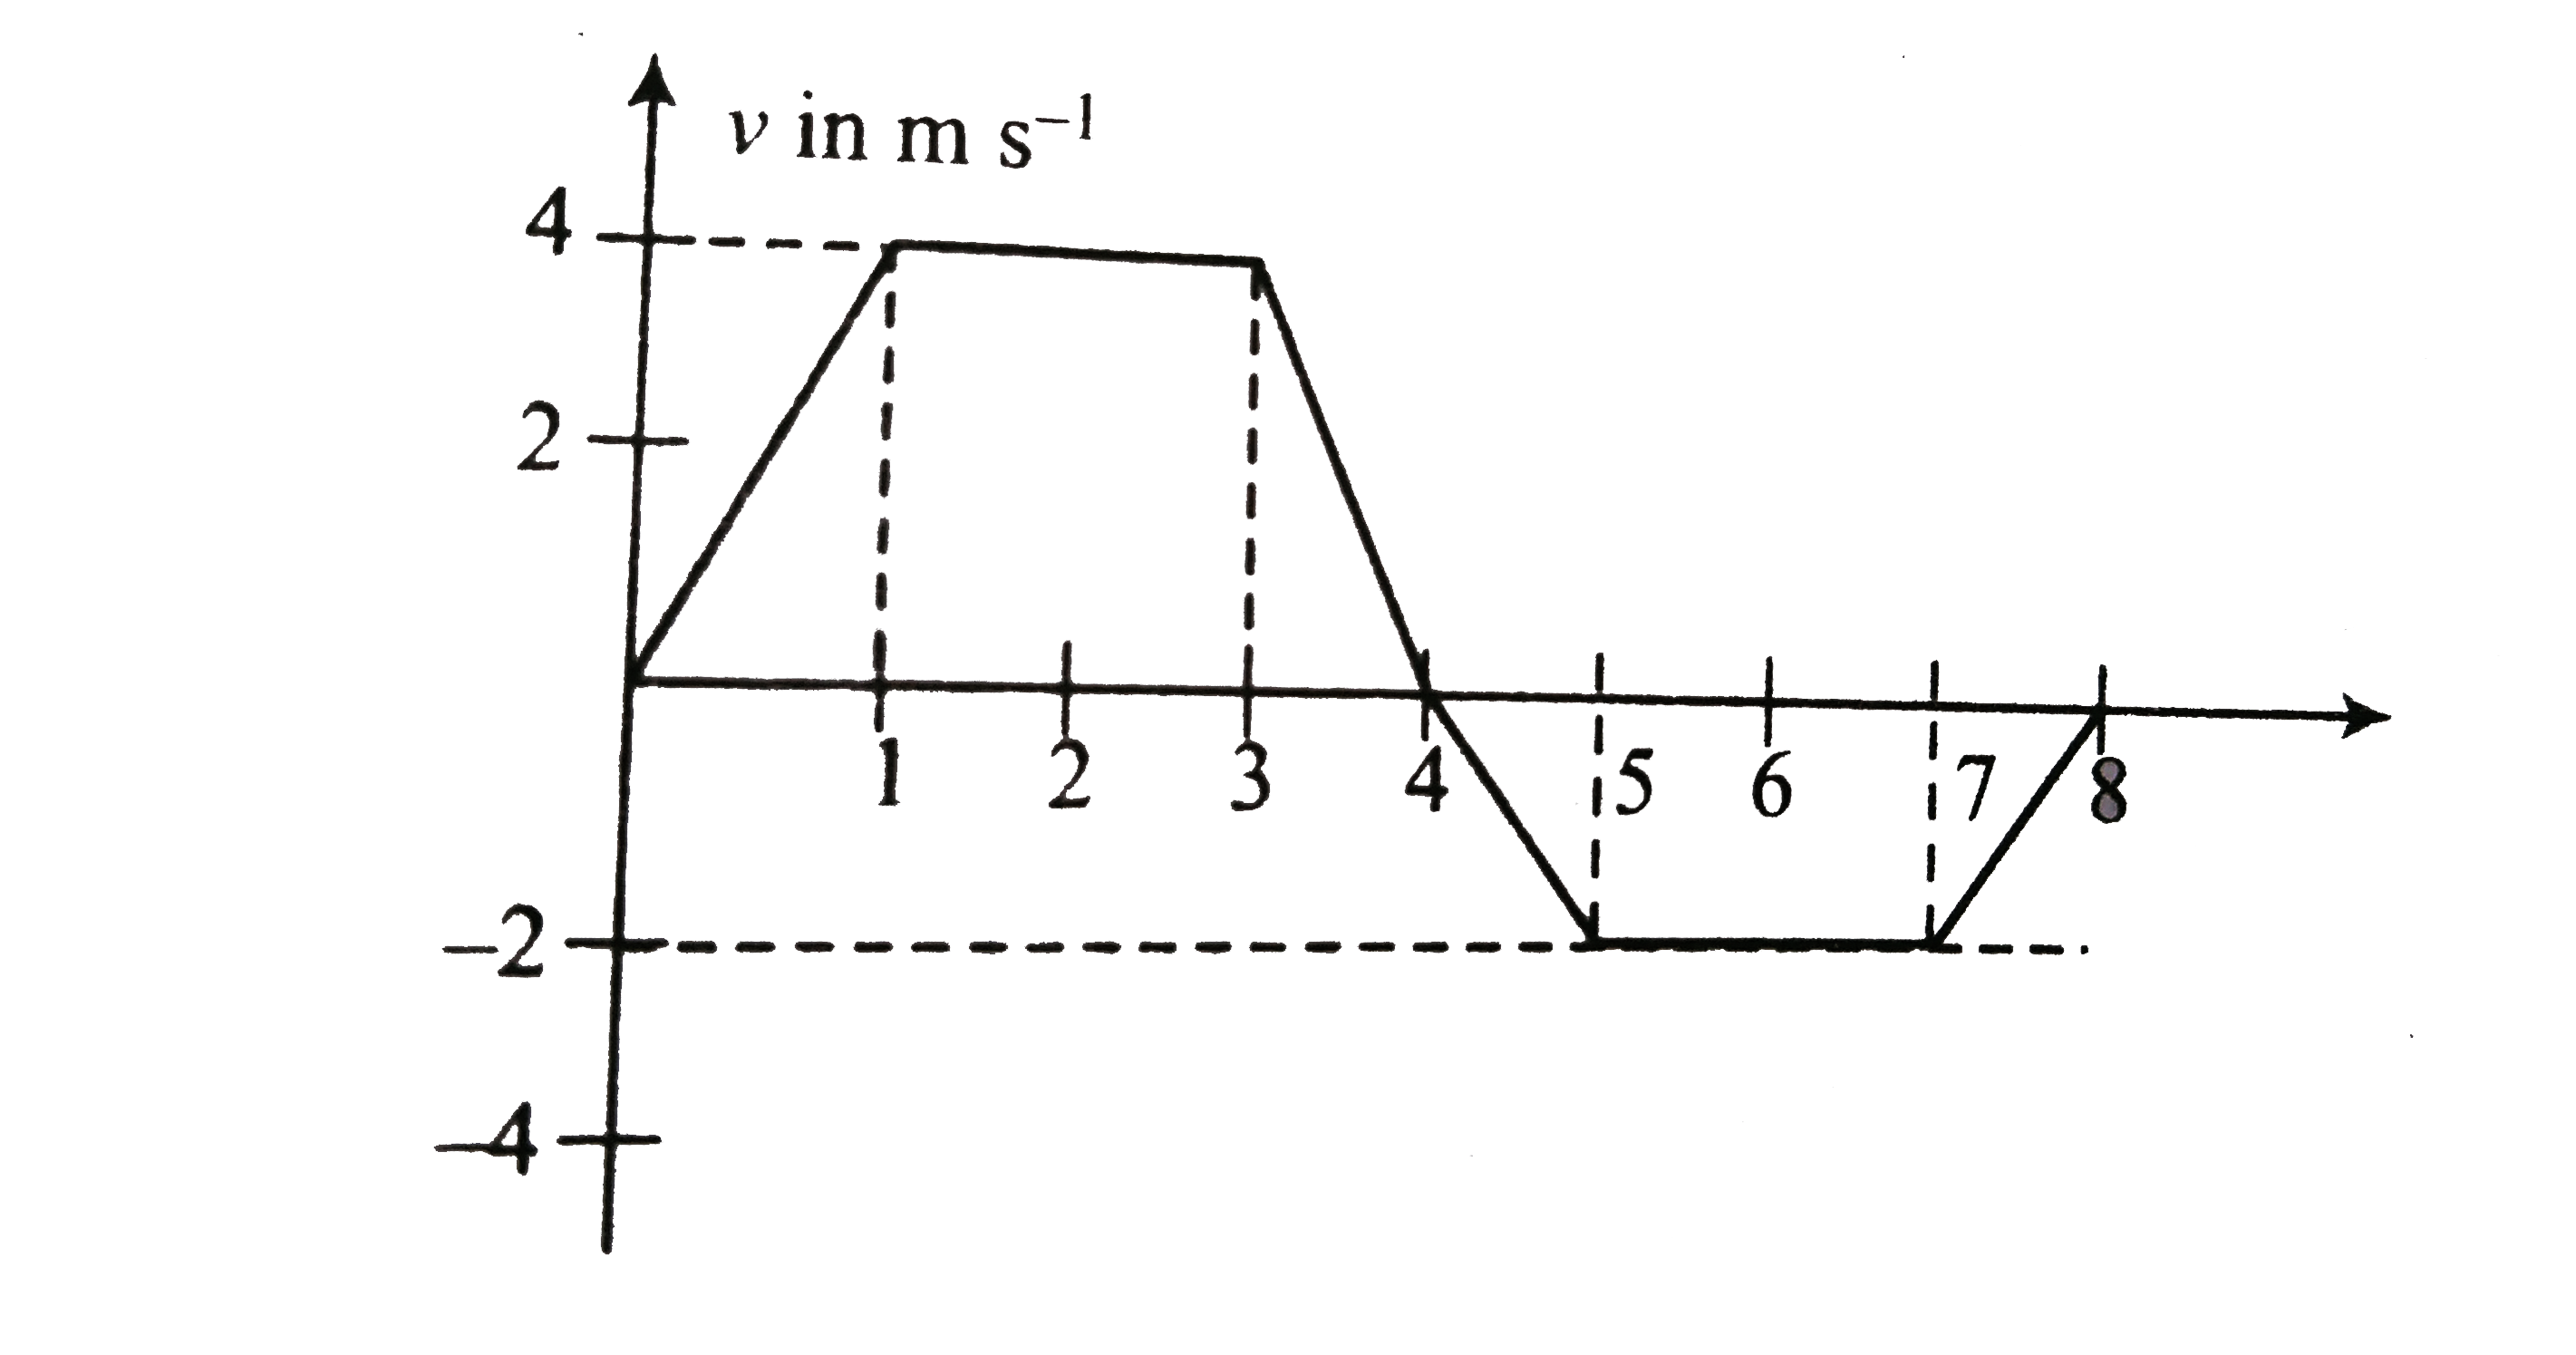
The velocity-time graph of a particle in straight line motion is veloity-time graph of a particle in straight line motion is shown in. The particle starts its motion from origin.
 .
.
Find the average acceleration from 2s to 6s.
View SolutionThe velocity time plot for a particle moving on straight line is shown in the figure.
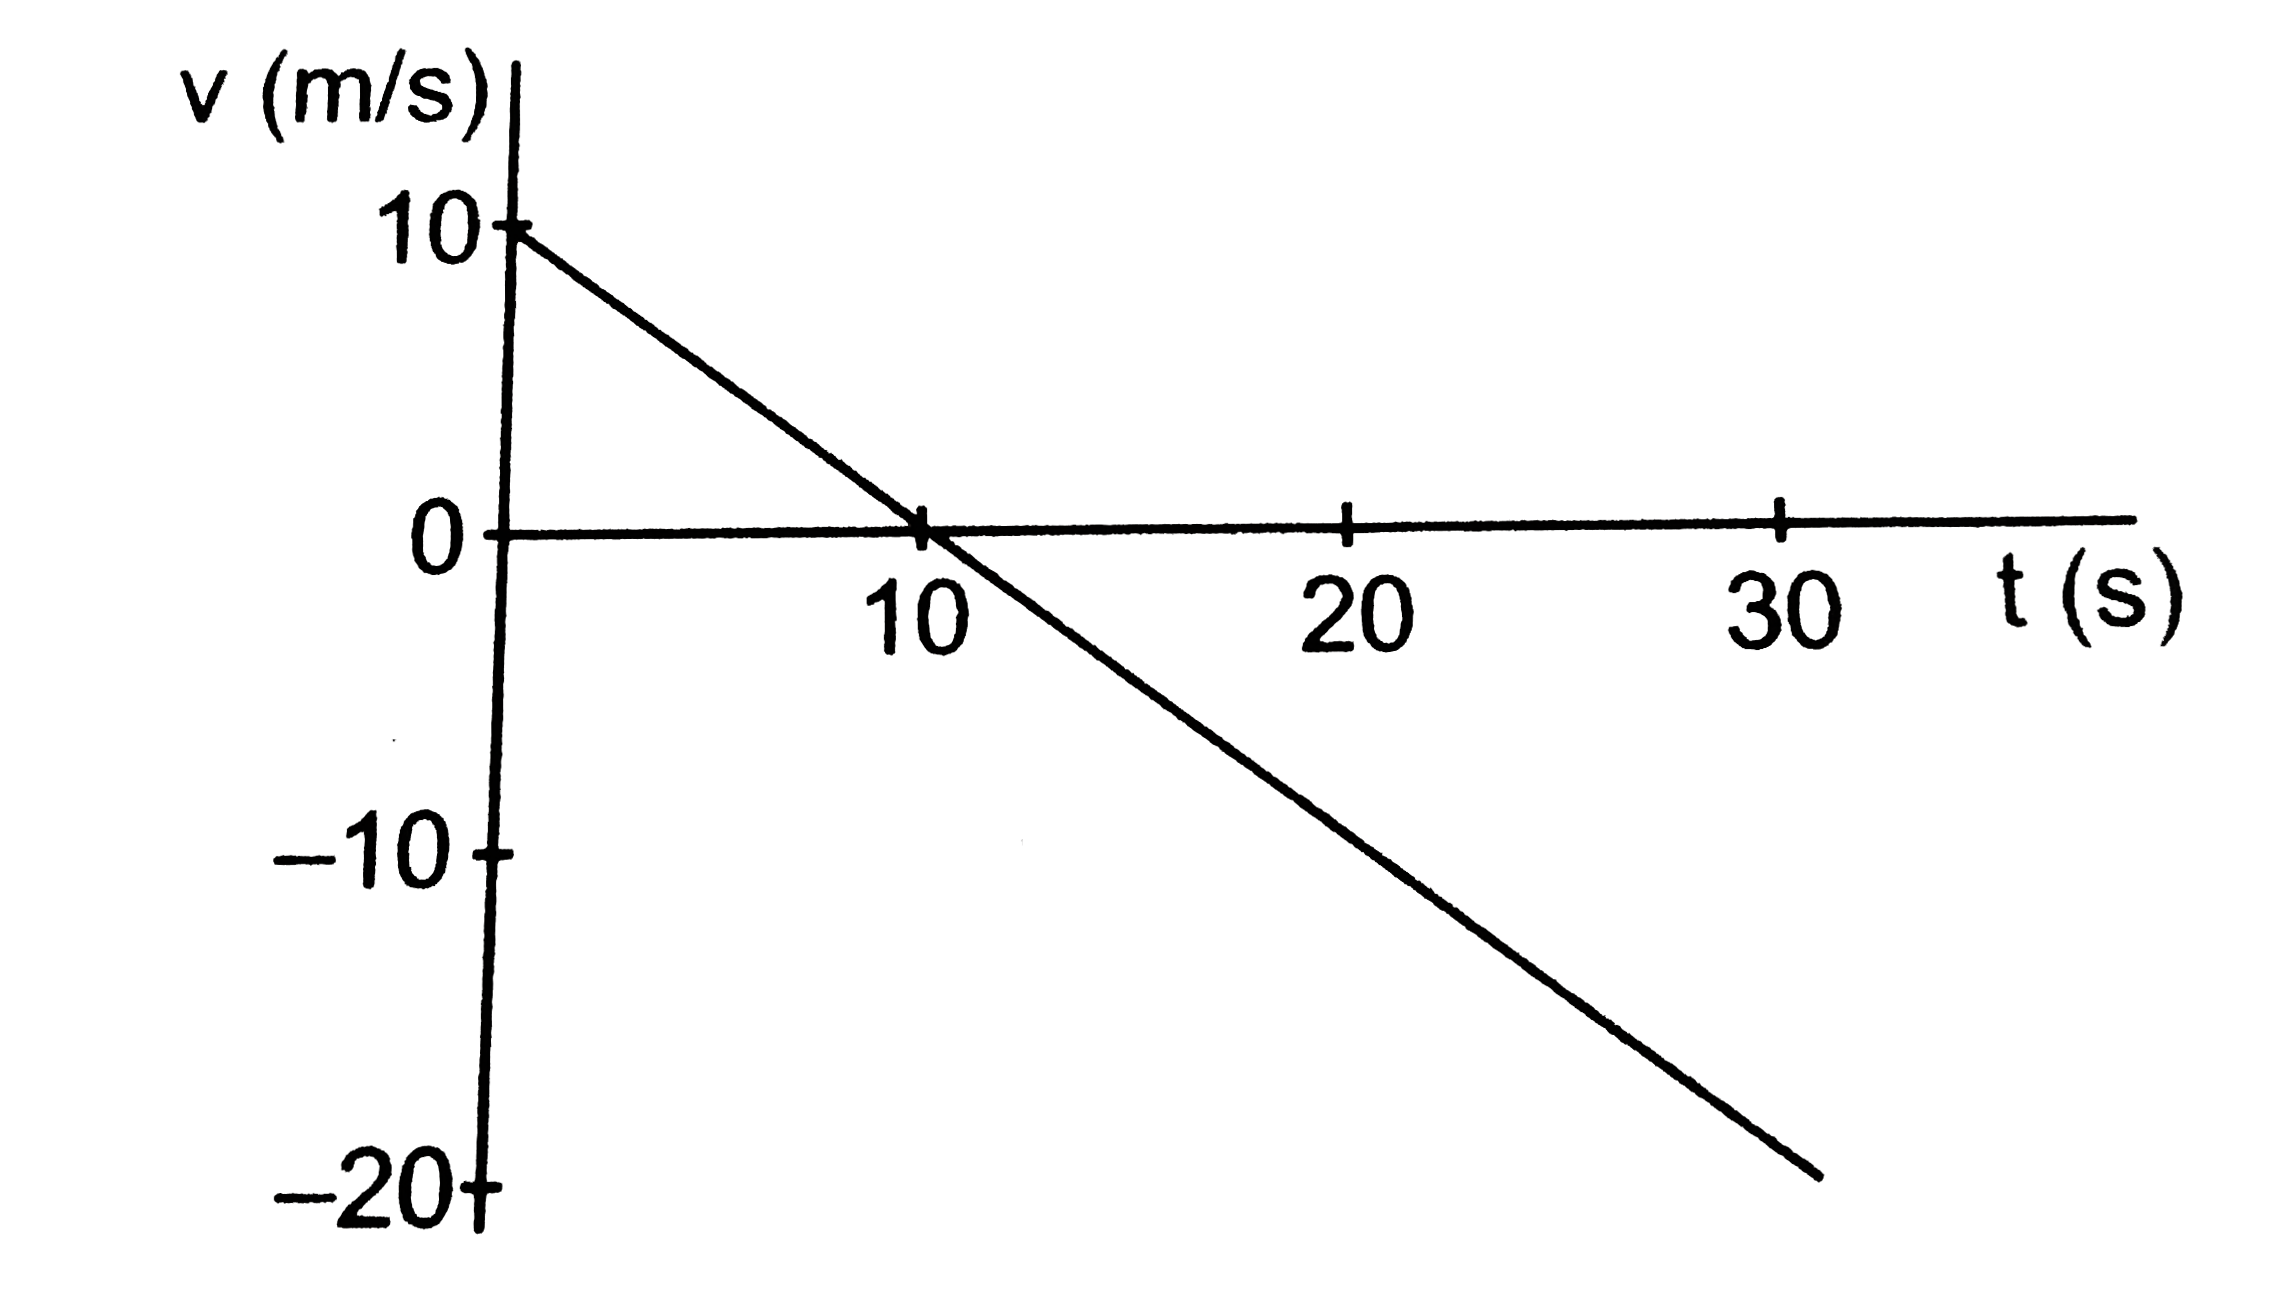
View SolutionThe velocity time plot for a particle moving on straight line is shown in the figure.

View SolutionThe motion of a particle in straight line is an example of
View SolutionDisplacement time graph of a particle moving in a straight line is a shown in figure.

View SolutionVelocity displacement graph of a particle moving in a straight line is as shown in figure.

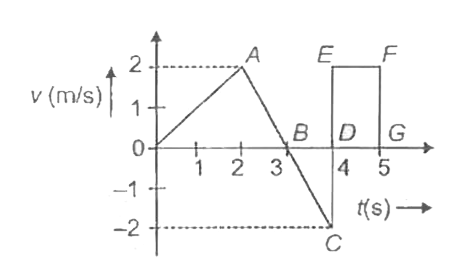
View SolutionThe velocity - time graph of a particle moving along a straight line is shown in the figure given below
The displacement of the particle in 5 second is
View SolutionA particle is in straight line motion with uniform velocity A force is not required
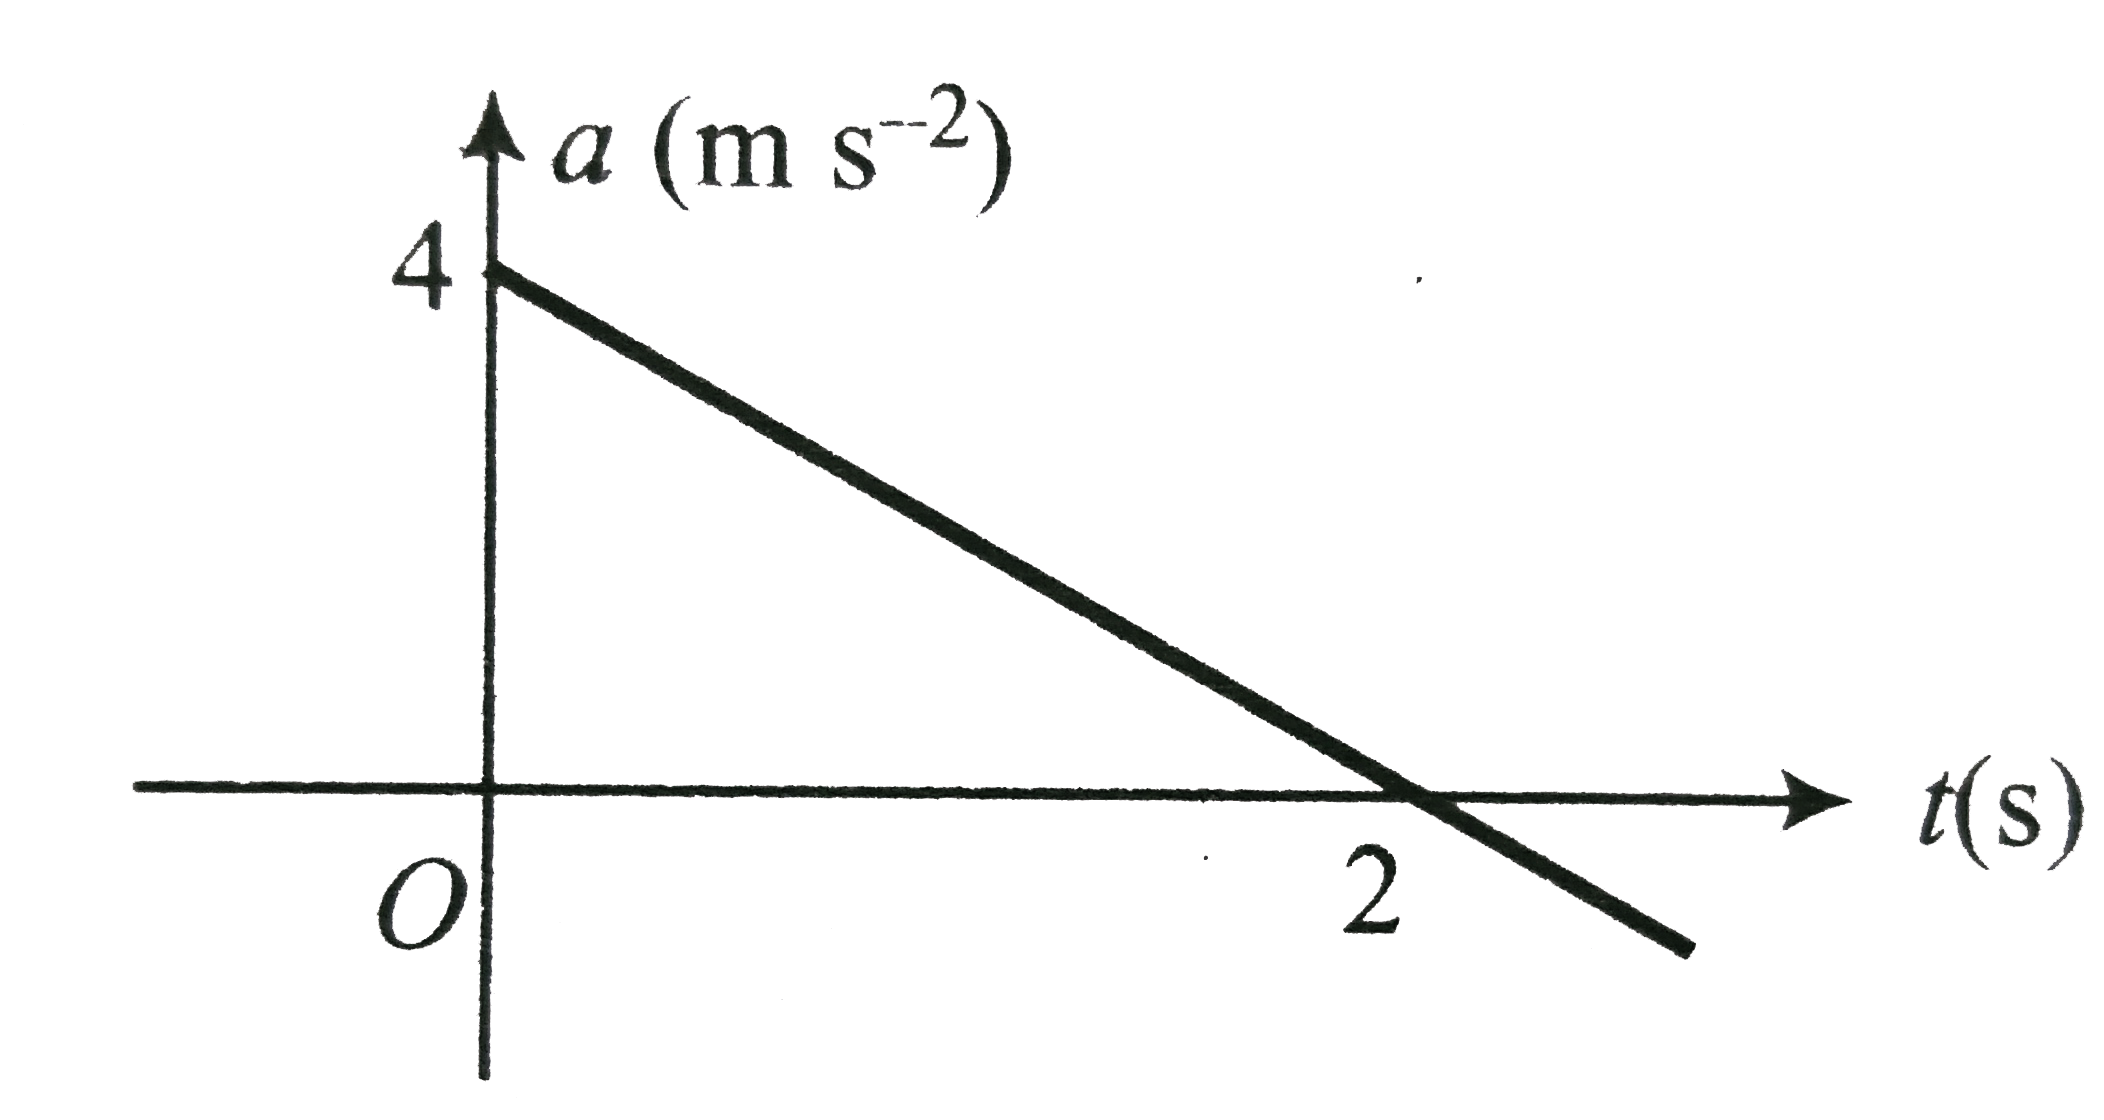
View SolutionThe acceleration versus time graph of a particle moving in a straight line is show in. The velocity-time graph of the particle would be
 .
.
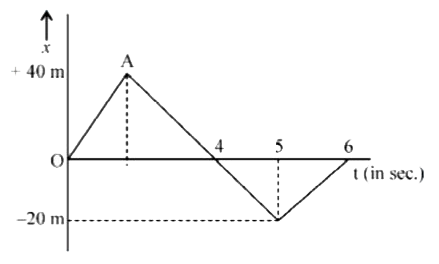
View Solutions-t graph of a particle in motion is shown in Fig. Calculate Average velocity
View Solution
