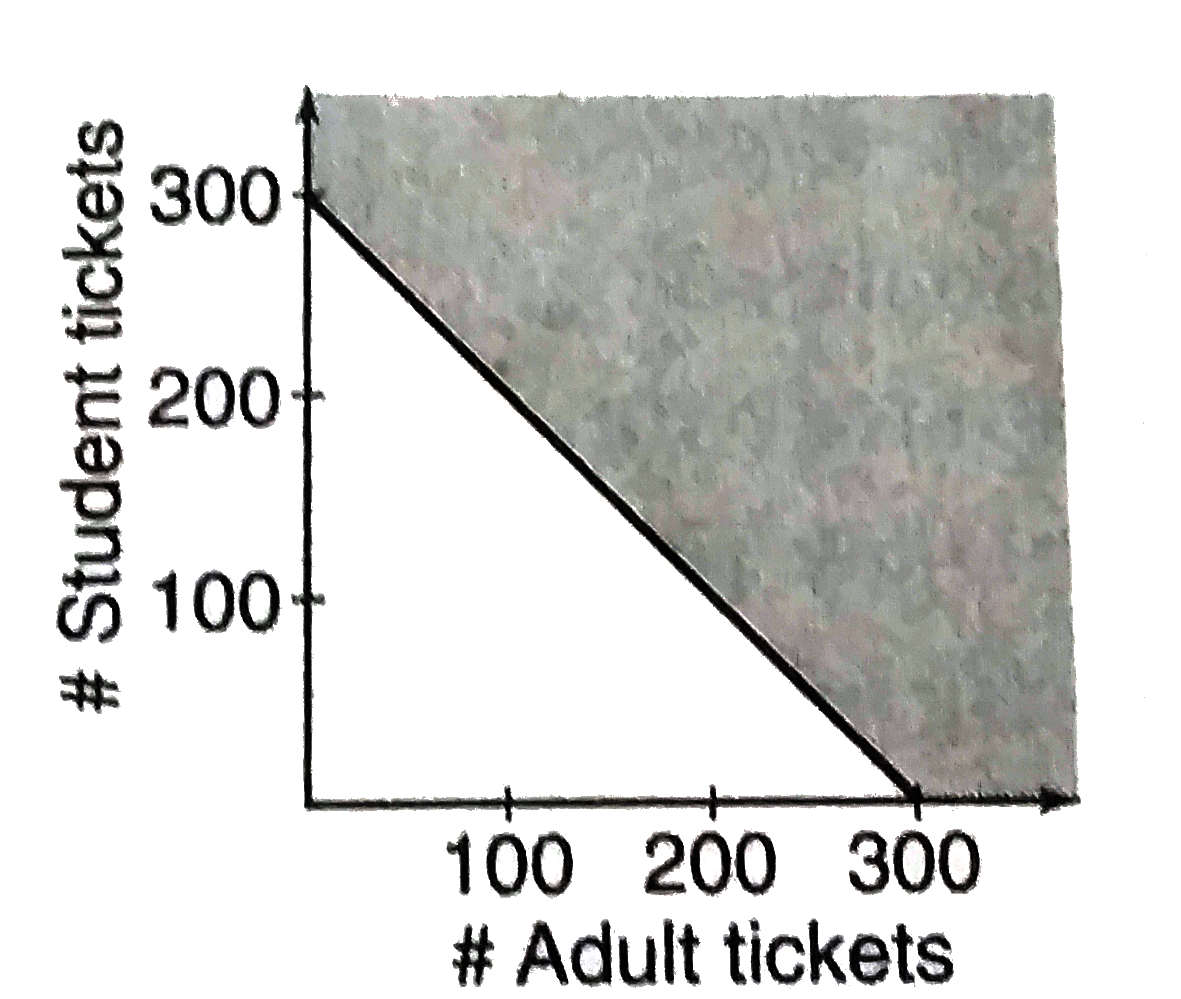
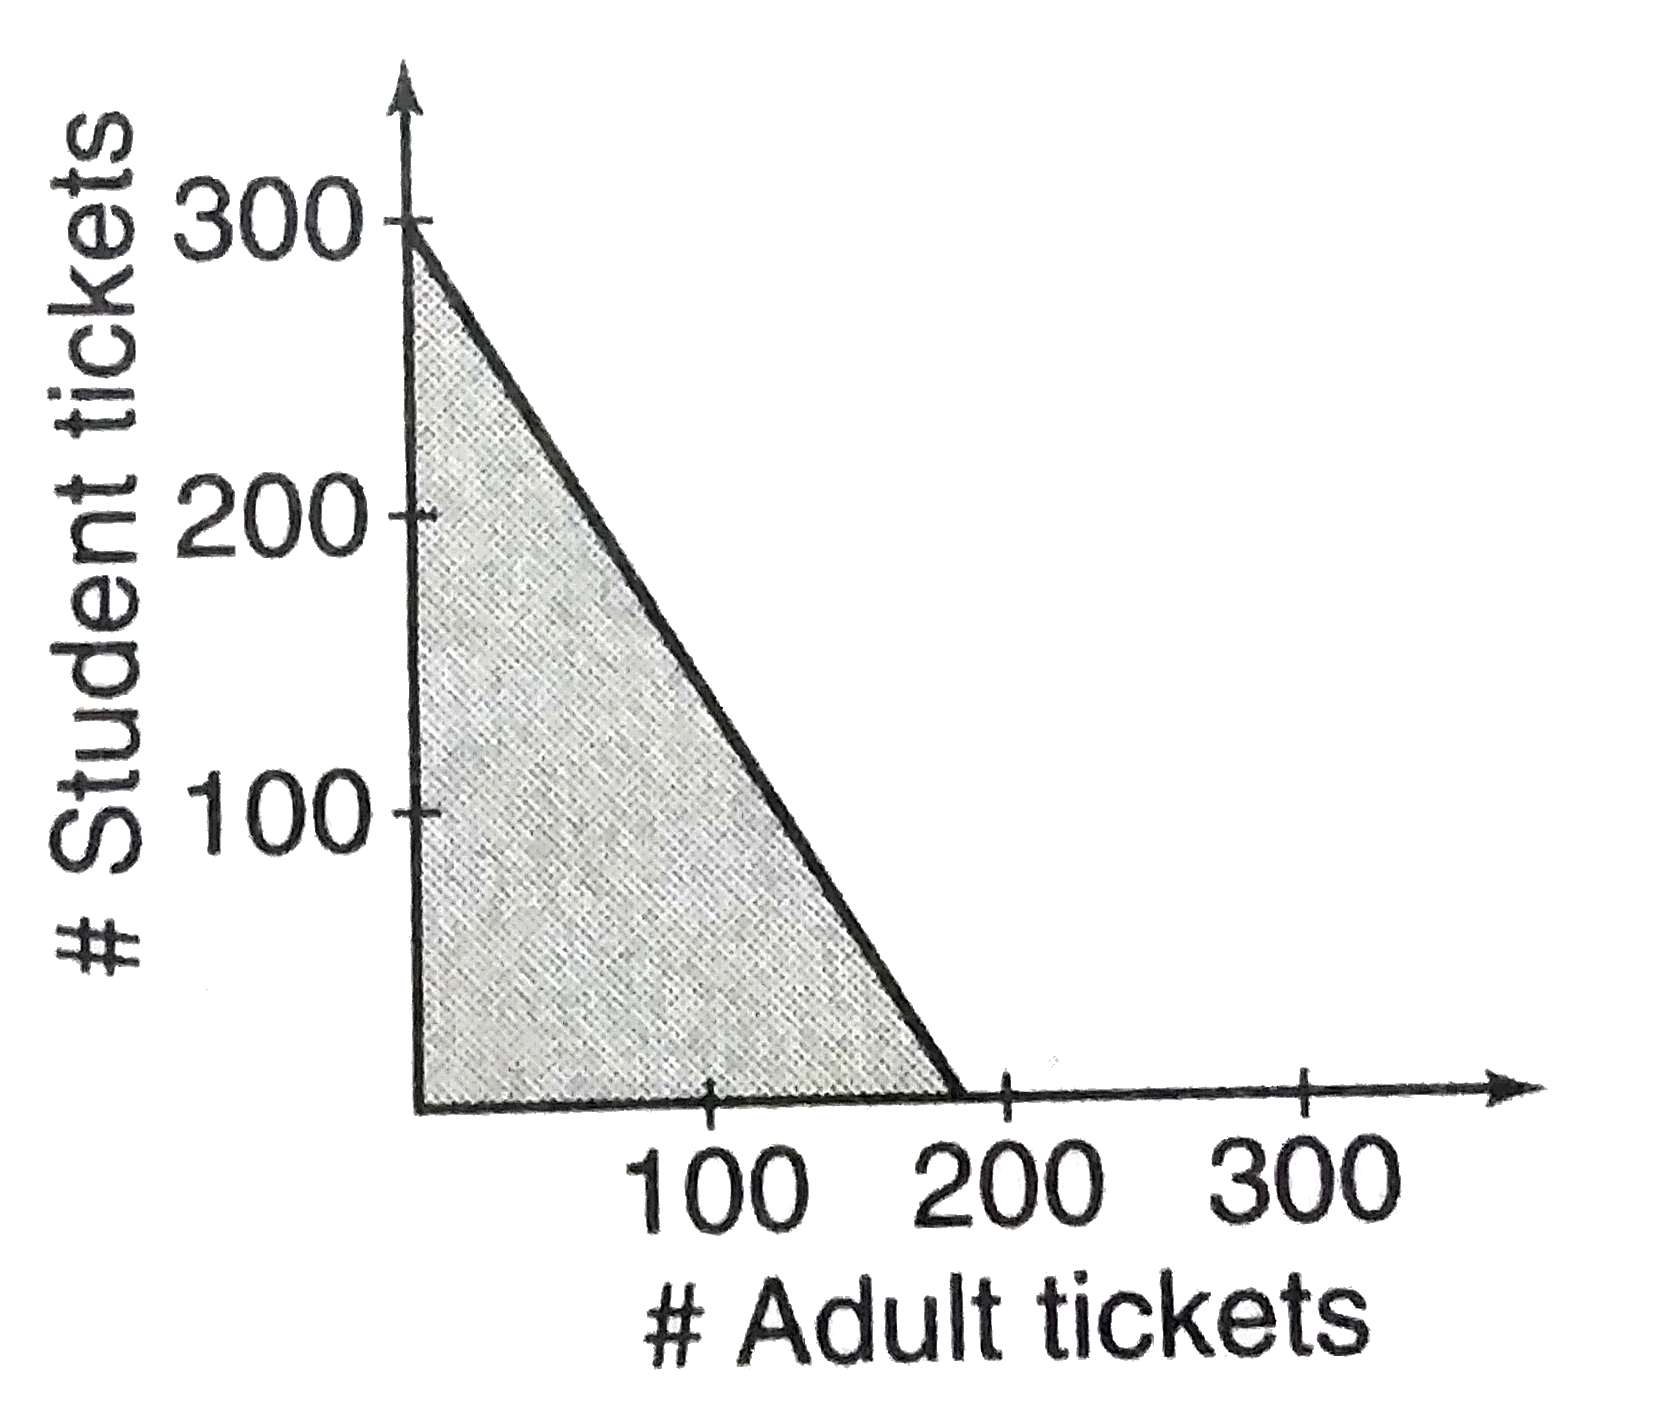
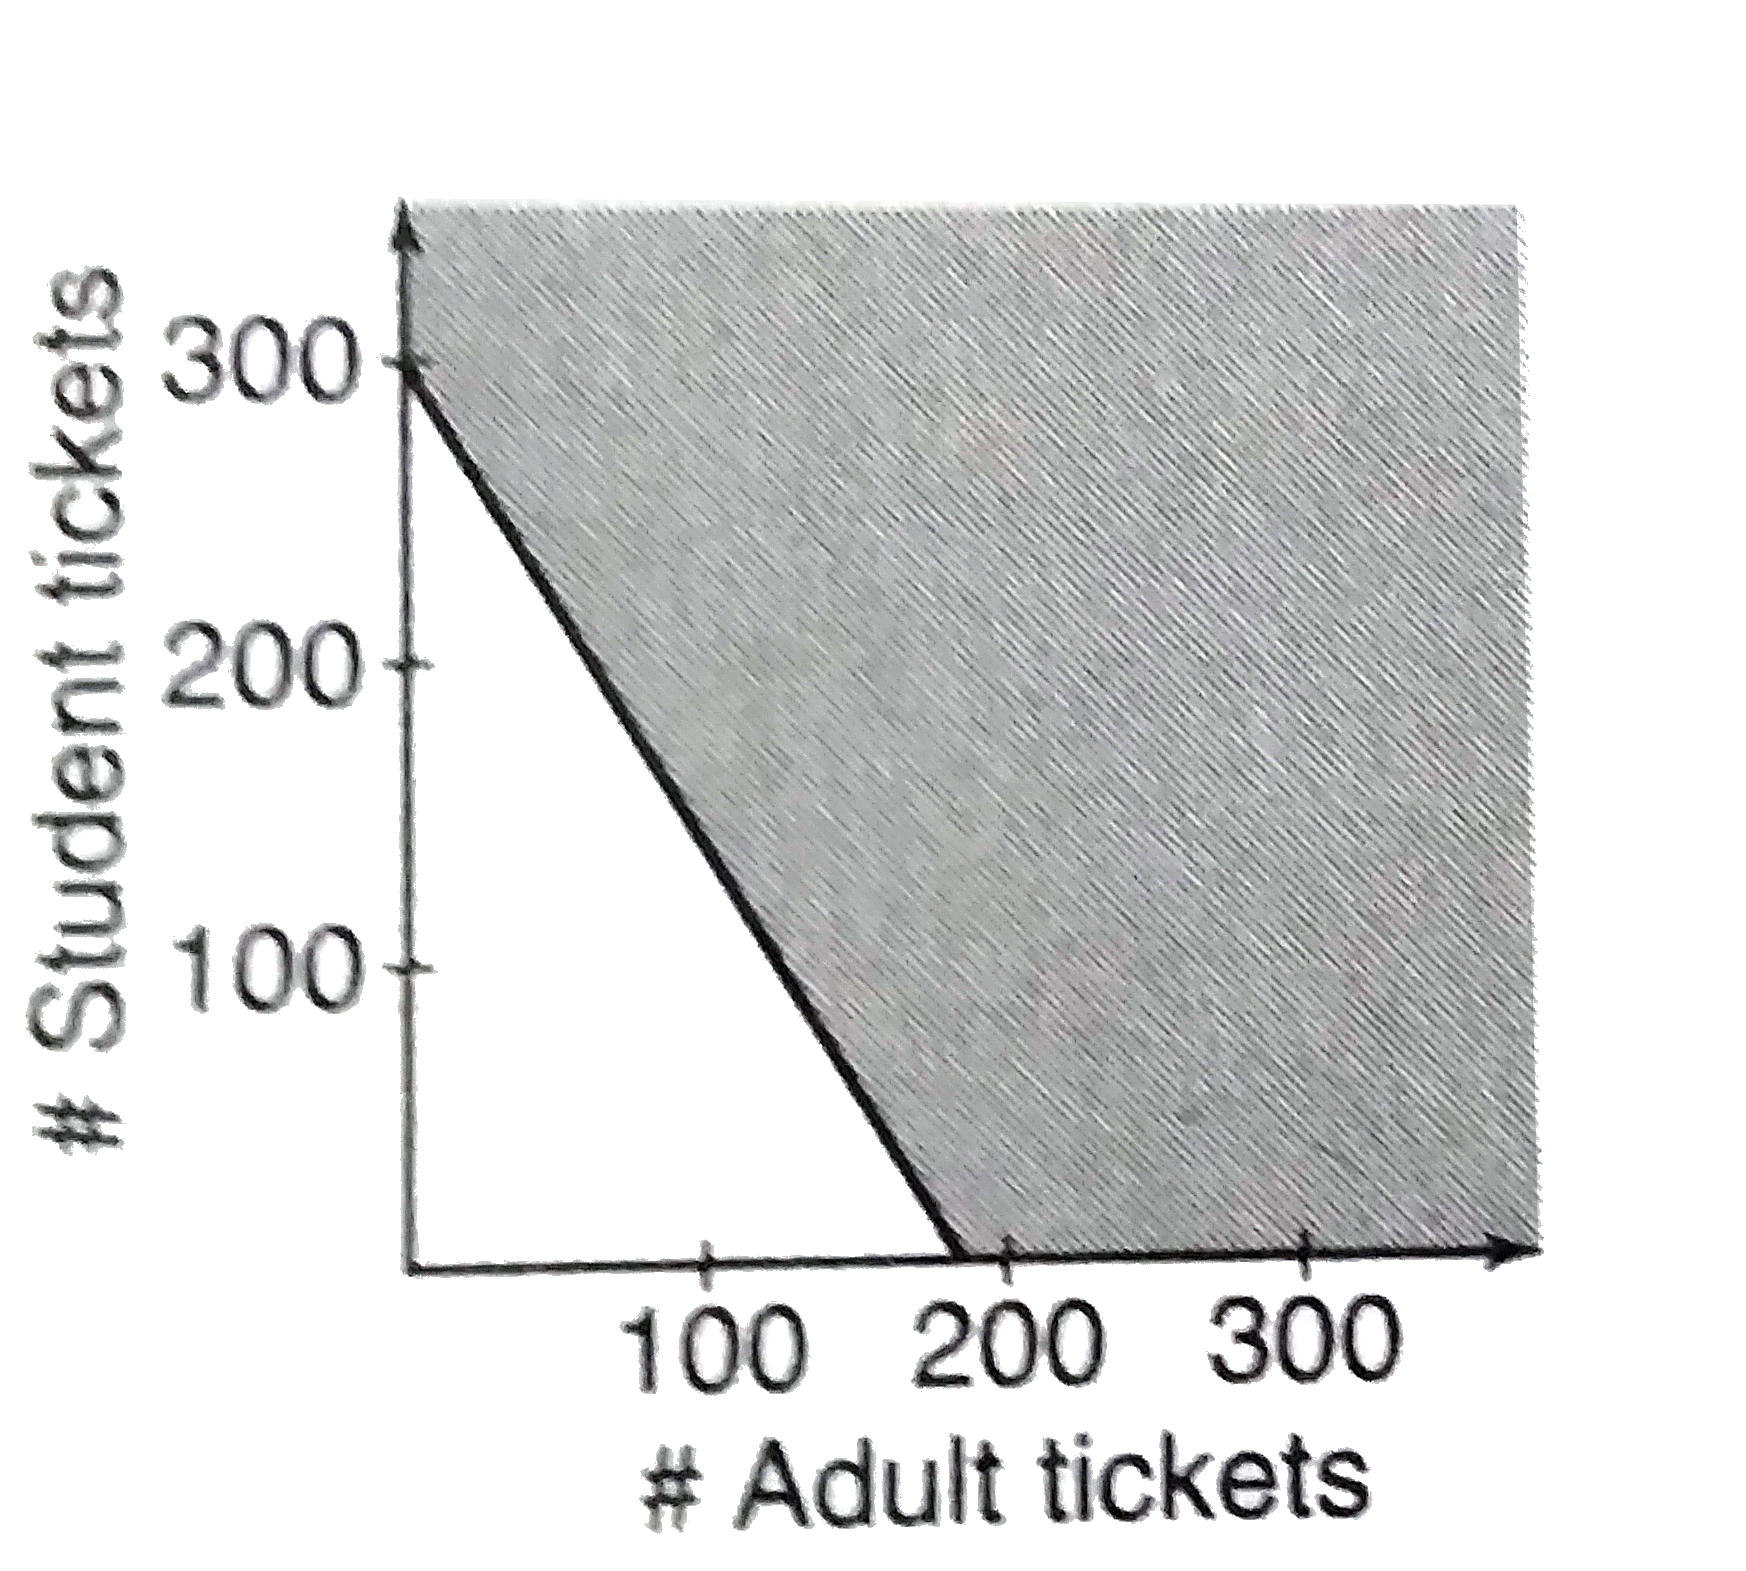
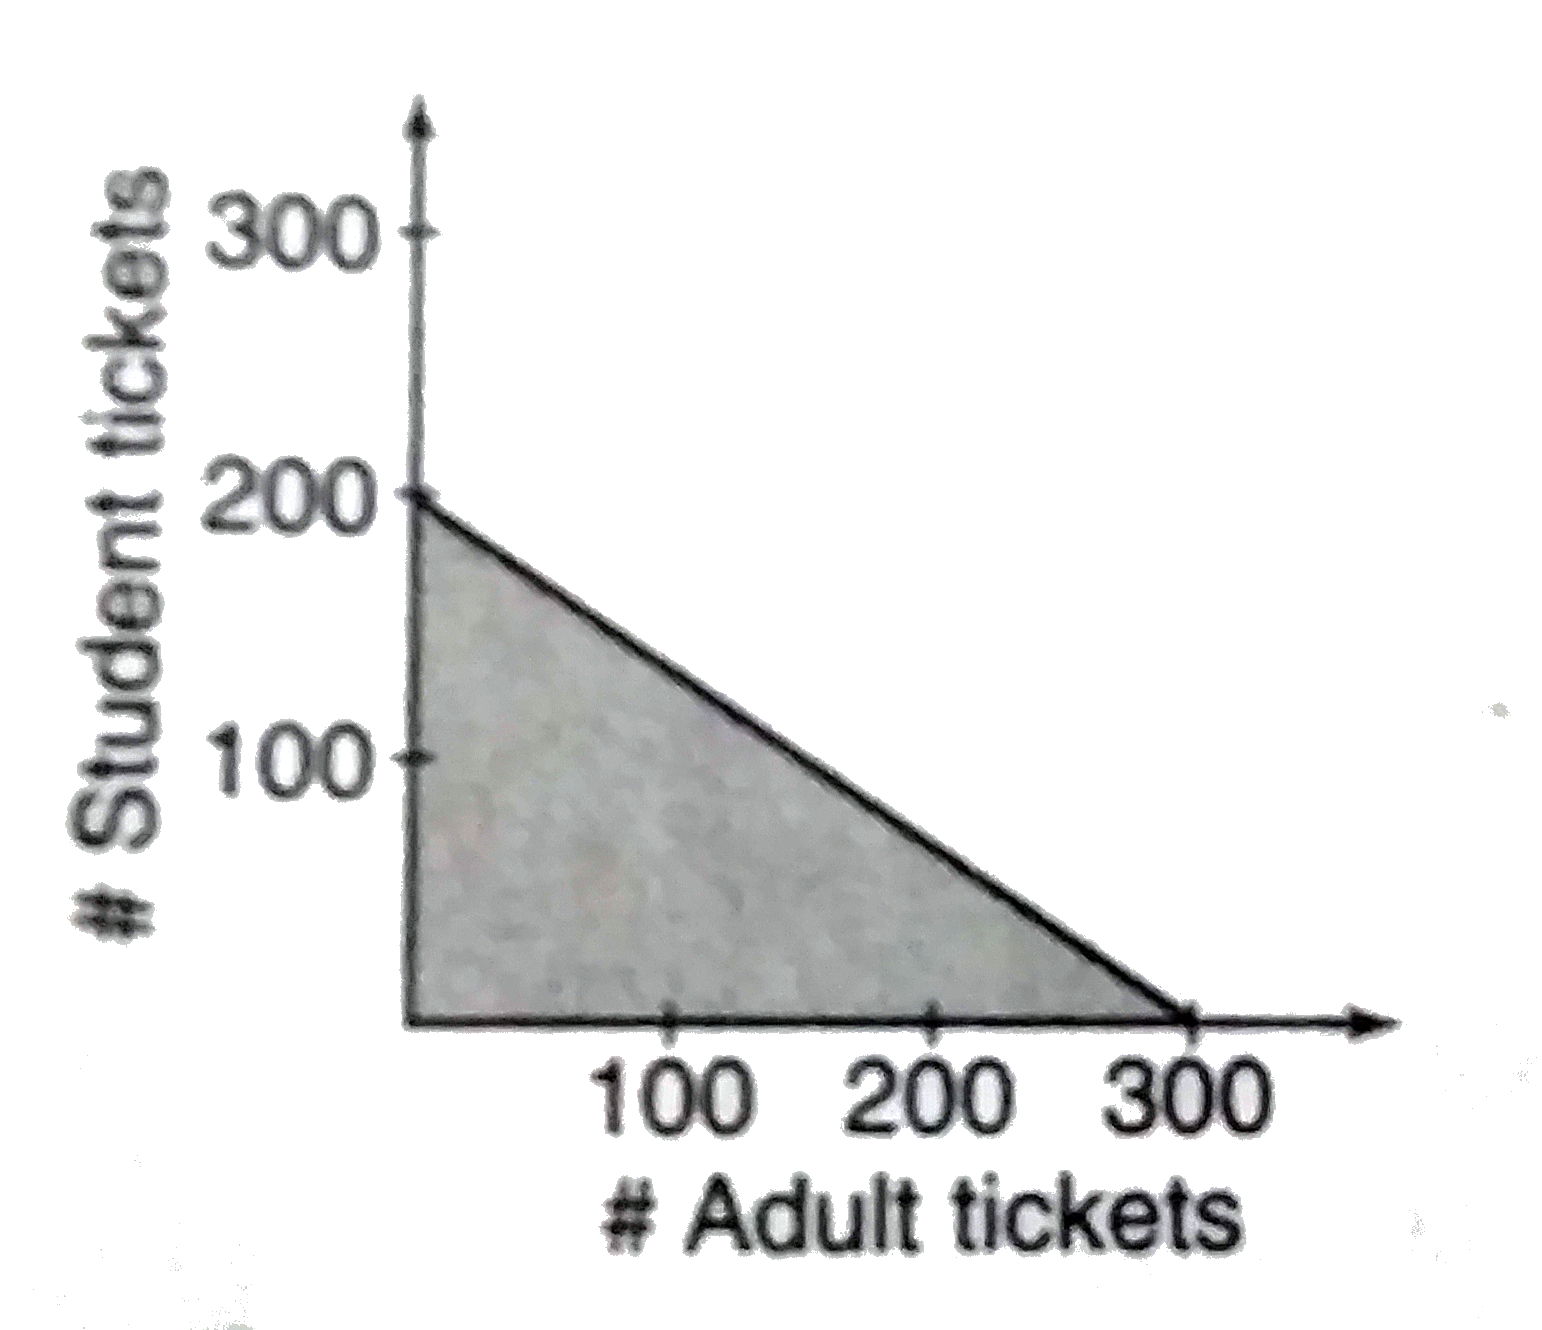
Tickets to the annual Follies Show at Littleton High School are $4 for adults and $2.50 for students. There is a cost of $750 to produce the show. If the x-axis represents the number of adult tickets sold and the y-axis represents the number of student tickets sold, which graph represents all the possible combinations of ticket sales that allow the junior class to at least cover the cost of the show ?


The correct Answer is:C
Topper's Solved these Questions
- INTERMEDIATE ALGEBRA/COORDINATE GEOMETRYBOOK - ENGLISH SATCHAPTER - INTERMEDIATE ALGEBRA/COORDINATE GEOMETRYEXERCISE - EXERCISE
12 Videos
- IMPROVING YOUR MATH SCOREBOOK - ENGLISH SATCHAPTER - IMPROVING YOUR MATH SCOREEXERCISE - VERY CHALLENGING PROBLEMS
12 Videos
- LINEAR FUNCTIONS BOOK - ENGLISH SATCHAPTER - LINEAR FUNCTIONS EXERCISE - EXERCISES
7 Videos
Similar Questions
Tickets for a school talent show cost $2 for students and $3 for adults. If Chris spends at least $11 but no more than $14 on x student tickets and 1 adult ticket, what is one possible value of x ?
View SolutionA box contains 50 tickets. Each ticket is numbered from 1 to 50. One ticket is selected at random, find the probability that the number on the ticket is not a perfect square.
View Solution
Knowledge Check
The number of tickets of movie E sold in Chennai is what per cent of number of tickets of movies A sold in Mumbai?
A170B70C30D130What is the difference between the number of tickets of movie D sold in Kolkata and the number of tickets of movie B sold in Lucknow?
A700B6000C14000D9000What is the average number of tickets of movie C sold in all the six cities?
A15500B2550C24000D25500
A bag contains 25 tickets, numbered from 1 to 25. A ticket is drawn and then another ticket is drawn without replacement. Find the probability that both tickets will show even numbers.
View SolutionA bag contains 25 tickets, numbered from 1 to 25. A ticket is drawn and then another ticket is drawn without replacement. Find the probability that both tickets will show even numbers.
View SolutionA bag contains 19 tickets, numbered from 1 to19. A ticket is drawn and then another ticket is drawn without replacement. Find the probability that both tickets will show even numbers.
View SolutionA bag contains 25 tickets, numbered from 1 to 25. A ticket is drawn and then another ticket is drawn without replacement. Find the probability that both tickets will show even numbers.
View SolutionThe number of tickets of movie B sold in Hyderabad was approximately, what per cent of the total number of tickets of the same movie sold in all the cities together?
View Solution
